
The fastest reliable way to automate marketing reports is to govern and normalize your source data first, then automate scheduled pulls into a templated report with a short narrative layer, and pilot the whole thing on one or two report types before rolling it out wider. Score your data readiness this week, pick a single report to automate, and run a two-week pilot. Gleanit is built to run exactly that pilot.
TL;DR:
- Ensure your source data is standardized and reliable before automating reports, focusing on naming conventions, currency, and attribution models.
- Prioritize automating high-frequency, formulaic reports like weekly KPIs and anomaly alerts, and keep complex or judgment-heavy reports manual.
- Use a simple architecture such as spreadsheet connectors or a warehouse with BI tools suited to your scale, and layer AI insights for efficiency.
- Regularly monitor common failure points like API limits, schema changes, and time zone issues to prevent inaccurate or broken reports.
- Conduct a two-week pilot on a single report type with your most stable data sources, then measure time saved before expanding automation efforts.
Table of Contents
- What Does It Take to Automate Marketing Reports Successfully?
- How Do You Set Up Automated Marketing Reports Step by Step?
- Why Does Data Governance Matter More Than the Tool You Pick?
- Which Marketing Reports Should You Automate First?
- What Reporting Architecture Should You Actually Use?
- What Does It Cost to Automate Marketing Reports, and How Fast Is the Payoff?
- What Actually Breaks When You Automate Marketing Reports?
- How Does Gleanit Map to This Playbook?
- What’s the Fastest Starting Workflow for an Agency?
- See What Gleanit Can Automate for Your Client Reports
- Sources
What Does It Take to Automate Marketing Reports Successfully?
Automating a marketing report is not a connector problem. It’s a data problem wearing a connector’s clothes. Most teams jump straight to “which tool pulls from Google Ads and Meta into a slide deck,” when the real question is whether their campaign naming, currency formats, and attribution windows are consistent enough that automation won’t just repeat their mistakes faster.
A readiness scorecard forces that question before you write a single Zap or API call. Score yourself honestly across five dimensions, each worth up to 2 points:
- Access: Do you have admin or API-level access to every platform you need (ad accounts, CRM, GA4, spreadsheets), or will you be waiting on IT tickets mid-pilot?
- Ownership: Is there one named person accountable for each data source who can answer “why did this number change” within a day?
- KPI definition: Are your core metrics (CAC, ROAS, MQL, whatever matters to your stakeholders) defined the same way across every channel and every team member’s spreadsheet?
- Sample size: Does the account or client have enough volume that a week-over-week automated report won’t just show noise?
- Refresh SLAs: Do you know how often each data source actually updates, and does that match how often you plan to report?
Add up your score out of 10. A 0 to 4 means delay automation. Fix your naming conventions and access issues first, or you’ll spend more time debugging automated errors than you ever spent building reports by hand. A 5 to 7 means pilot with fixes in parallel. Pick the cleanest data source, automate that one report, and patch the weaker dimensions as you go. An 8 to 10 means go ahead and build the full pipeline.
Gartner’s data quality guidance treats data quality as a top priority for any analytics program, and that holds especially true here: automation doesn’t fix bad data, it just distributes bad data faster and to more people.
Pro Tip: Run your readiness score separately for each client or business unit if you manage multiple accounts. A 9 out of 10 on your best-run client and a 3 out of 10 on your messiest one means two very different rollout timelines, not one blended average.
If your remediation list is longer than three items, don’t try to fix everything before piloting. Fix the naming convention and the KPI definitions first. Those two alone cause most of the downstream attribution headaches.
How Do You Set Up Automated Marketing Reports Step by Step?
Once you’ve cleared the readiness bar, the build itself follows a fairly predictable sequence. Skipping steps here is exactly how teams end up automating a report nobody trusts.
-
Define your audiences and their KPIs separately. An executive wants three numbers and a trend line. A client wants a narrative tied to their goals. A channel manager wants granular spend-to-conversion data. Trying to serve all three with one report format is the single most common design mistake.
-
Build minimal templates before you automate anything. Sketch each report on a single page or slide: what metrics, what visual, what narrative sentence. If you can’t fit it on one page manually, automating it won’t fix the clutter.
-
Map your data sources and lock down access. List every platform feeding each template (Meta Ads, Google Ads, LinkedIn, CRM, GA4) and confirm you have durable API or connector access, not a login that expires when someone leaves the team.
-
Choose your connector strategy. For a lean setup, tools like Zapier’s marketing automation connectors pull data straight from ad platforms and CRMs into a centralized sheet or report tool. For agencies juggling many clients, a warehouse-first approach scales better once the connector sprawl gets unmanageable.
-
Normalize and validate before automating the pull. Standardize campaign naming, currency, and time zones. Set a dedup rule for any metric that could double count (cross-platform conversions are the usual suspect). This is also where you lock in your attribution windows and metric definitions so every future report uses the same math.
-
Build the actual output and set the delivery schedule. Decide the format: an email digest, a Slack alert, a PDF, or a slide deck link. Decide the cadence: daily anomaly checks, weekly digests, monthly client decks. Match the schedule to how often the underlying data refreshes, not to what looks tidy on a calendar.
-
Add a templated narrative layer, then pilot it. A table of numbers without context gets skimmed and ignored. A one or two sentence AI-assisted or human-written narrative that flags what changed and why turns a report into something people actually read. Funnel’s guide to reporting automation makes this point directly: scheduled narrative reports get read far more consistently than static dashboards ever do.
-
Measure time saved and iterate. Track how long the manual version used to take versus the automated version, including the time spent fixing errors. If the automated report needs constant manual patching, you skipped a step back in normalization.
Pro Tip: Pilot on your most stable, highest-visibility report first, not your messiest one. An executive weekly digest with three clean KPIs proves the concept fast. A 40-tab client master report will bury you in edge cases before you’ve proven anything works.
Why Does Data Governance Matter More Than the Tool You Pick?
Automating a report before your data is normalized doesn’t just risk small errors. It actively produces inaccurate attribution and inflated or deflated KPIs, because the automation faithfully repeats whatever inconsistency already exists in your source data, just on a schedule now. Adobe’s guidance on campaign analytics stresses unifying data into a modeling-ready state before any serious automation work begins, and that’s not vendor caution talking. It’s the difference between a report that’s wrong once and a report that’s wrong every Monday morning at 8 AM.
The normalization work itself is mechanical but non-negotiable:
- Standardize naming conventions across campaigns, ad sets, and UTM parameters so the same campaign doesn’t show up as three different rows in three different platforms.
- Align currency and time zone formatting, especially if you manage clients or campaigns spanning multiple regions. A campaign that “ended” at midnight UTC but midday local time will show phantom spend in your last-day totals.
- Set explicit deduplication rules for any conversion event that could be tracked by more than one platform, which is nearly every conversion event in a modern multi-channel funnel.
- Document your attribution model (last-touch, linear, data-driven, whatever you use) in one place that every report pulls from, rather than letting each analyst apply their own assumption.
Attribution alignment deserves its own line item because it’s the single biggest source of “why don’t these two reports agree” disputes. If your Google Ads dashboard and your CRM are using different attribution windows, an automated report that blends both sources will produce numbers that look precise but mean nothing. Building a consistent cross-channel attribution approach before automation prevents that mismatch from ever reaching a stakeholder’s inbox.
Minimum validation checks worth running on every scheduled report cycle: confirm total spend matches the platform’s native dashboard within a small margin, confirm conversion counts haven’t dropped to zero (a common sign of a broken connector, not a real trend), and confirm the reporting period actually matches what the template claims it covers.
Governance work is genuinely the largest engineering lift in any automation project, and skipping it doesn’t save time. It just moves the time cost from “before automation” to “every week after,” when someone has to manually audit numbers they no longer trust. A solid grounding in multi-touch attribution modeling pays for itself the first time a client asks why last month’s ROAS jumped 40 percent overnight.
Which Marketing Reports Should You Automate First?
Not every report deserves automation, and treating them all the same is how teams burn a quarter building infrastructure for reports nobody reads. Prioritize the ones that are frequent, formulaic, and high visibility.
Four report types return value almost immediately:
- Weekly KPI digest for internal stakeholders: three to five core metrics, one trend chart, and a two-sentence “what changed” note.
- Monthly client deck: the same core metrics reframed against the client’s specific goals, with one slide of context and a “next actions” slide.
- Channel spend versus conversions: a recurring view that flags which channels are earning their budget, useful weekly for paid media managers.
- Anomaly alerts: a Slack or email ping the moment spend spikes, conversions flatline, or a campaign pauses unexpectedly, rather than waiting for the next scheduled report to notice.
Every one of these templates works best with the same shape: three to five KPIs (more than that and nobody reads past the first three), one chart, one short narrative sentence explaining the “why” behind the number, and one line of recommended next action.
| Report type | Best cadence | Automate or keep manual |
|---|---|---|
| Executive KPI digest | Weekly | Automate |
| Monthly client deck | Monthly | Automate core numbers, keep narrative human-reviewed |
| Channel spend vs. conversions | Weekly | Automate |
| Anomaly alerts | Real time / daily | Automate |
| Strategic quarterly review | Quarterly | Keep manual |
| New client onboarding report | Once per client | Keep manual |
Strategic reviews and onboarding reports should generally stay manual. They require judgment calls and context that a template can’t reliably capture, and they don’t repeat often enough to justify the build time. Automating those is a solution looking for a problem.
What Reporting Architecture Should You Actually Use?
Three architectures cover almost every real-world setup, and picking the wrong one for your scale is a common way to overbuild or underbuild your reporting stack.
- Spreadsheet plus connector, using tools like Zapier to pull data from ad platforms straight into a shared sheet. Cheap, fast to set up, and fine for a single team or a handful of clients. It starts to strain once you’re managing more than a few accounts, because every new data source means another manual connector to maintain.
- ETL to warehouse to BI tool, where raw data lands in a warehouse, gets transformed, and feeds a business intelligence layer. This scales far better for agencies juggling many clients and complex attribution needs, but it takes real setup time and usually a dedicated analytics person to maintain.
- Agentic AI narrative layer, where an AI system sits on top of your existing data connections and generates the written summary, flags anomalies, and drafts the client-facing narrative automatically. This is where a platform like Gleanit fits, layering AI-generated reporting on top of consolidated ad and funnel data rather than replacing the underlying connectors.
Delivery channels matter as much as the architecture underneath them. Email digests still win for executive stakeholders who won’t log into a dashboard. Slack alerts work best for real-time anomaly flags that need someone to act fast. PDFs and slide decks remain the standard for client-facing monthly reports, especially in agencies where the deck itself is part of the deliverable. Shared drive links work when a client wants to explore the data themselves rather than just read a summary.
Security and ownership deserve real thought here, not an afterthought. Centralizing customer-level data across multiple platforms raises real privacy questions, and regulations like the California Consumer Privacy Act put specific constraints on how customer data can be collected, stored, and shared. When a report doesn’t need individual-level data to make its point, use aggregated metrics instead of raw customer records. It’s simpler to govern and it removes an entire category of compliance risk.
What Does It Cost to Automate Marketing Reports, and How Fast Is the Payoff?
Budget expectations should track the architecture you pick, not a flat industry number, because a single-client pilot and a 40-client agency rollout are entirely different projects.
| Scenario | Typical setup time | Cost shape |
|---|---|---|
| Single-report pilot (spreadsheet + connector) | 1 to 2 weeks | Low, mostly staff time plus a connector subscription |
| Multi-client agency rollout (warehouse + BI) | 4 to 8 weeks | Moderate to high, includes setup and ongoing analyst time |
| AI-assisted narrative platform (e.g. Gleanit) | 1 to 3 weeks | Subscription based, scales with seats or client workspaces |
The break-even math is straightforward once you know your numbers. If a report currently takes an analyst three hours to build manually each week, and that analyst’s fully loaded cost is $40 an hour, you’re spending $120 a week, or roughly $6,240 a year, just on that one report. Vendor and freelance case notes report time savings in the range of 4 to 6 hours per client per month on repetitive copy-paste reporting tasks once automated. Multiply that by your hourly rate and your client count, and most automation subscriptions pay for themselves inside the first billing cycle for agencies managing more than a handful of accounts.
Budget for maintenance, not just build. Set aside a small recurring block of time, an hour or two a month per report, to check for schema changes, broken connectors, and shifting KPI definitions. The marketing automation software market has grown around exactly this expectation: platforms that not only automate but actively maintain themselves as underlying data sources change.
What Actually Breaks When You Automate Marketing Reports?
Five failure patterns account for most of the automated reporting disasters teams run into, and every one of them is preventable with the right check in place.
-
API rate limits silently truncating data. A platform caps how many calls you can make per hour, and your report quietly pulls partial data without throwing an obvious error. Fix: build a data completeness check that flags when row counts drop below a historical baseline.
-
Schema changes breaking the pipeline overnight. A platform renames a field or changes a report structure, and your automated pull either fails outright or, worse, returns null values that get treated as zero. Fix: version your connector mappings and set alerts for unexpected null rates.
-
Attribution misconfiguration blending incompatible models. One data source reports last-touch, another reports first-touch, and the automated report merges them as if they measured the same thing. Fix: document and enforce one attribution standard at the pipeline level, not the report level.
-
Stale refreshes reporting yesterday’s numbers as today’s. A connector fails silently and the report keeps running on cached data nobody notices for weeks. Fix: timestamp every report with its actual last-refresh time, visibly, not buried in metadata.
-
Time zone bugs shifting spend into the wrong reporting period. Ad platforms often default to account-level time zones that don’t match your reporting calendar, skewing “yesterday’s” numbers. Fix: standardize every connector to one time zone at ingestion, not at display.
Pro Tip: Set a simple monitoring threshold: if any core KPI moves more than 30 percent week over week with no known campaign change, hold the report for manual review before it goes out. That single rule catches the majority of the failures above before a client ever sees them.
A quick rollback habit helps too: keep the prior week’s validated report on hand so you can compare new numbers against it before hitting send, and build a repeatable postmortem template for whenever something does slip through.
How Does Gleanit Map to This Playbook?
Gleanit was built around the exact sequence covered above rather than as a dashboard bolted onto existing spreadsheets. Its automated monitoring of ads and customer journeys across Meta, TikTok, Google, and LinkedIn handles the connector and normalization layer, pulling channel data into one connected view instead of forcing your team to reconcile five separate exports by hand. The funnel gap diagnostics flag where a client’s journey is actually breaking down, and the platform prioritizes fixes by ROI impact rather than dumping an undifferentiated metrics list on a stakeholder.
A sensible pilot configuration looks like this: connect two ad platforms plus your CRM, pick one weekly digest template, and let Gleanit’s AI-assisted reporting draft the narrative layer while a human reviews it before delivery. Weekly product updates mean the connector and template library keeps expanding, so a pilot built this month keeps gaining capability without a re-implementation project. Agencies running client-dedicated workspaces get the added benefit of keeping each account’s data and reporting cadence cleanly separated from the start.
What’s the Fastest Starting Workflow for an Agency?
If you take one thing from this guide, make it this: connect two ad platforms and GA4, build one weekly executive digest, and add one monthly client deck. That’s it. Don’t try to automate your entire reporting stack in month one.
This combination works because it balances effort against visible impact. Two ad platforms plus GA4 covers the majority of spend and conversion data for most accounts without the connector sprawl that kills momentum on bigger builds. A weekly digest proves the concept internally, fast, where mistakes are cheap to catch. A monthly client deck proves it externally, where the stakes and the visibility are higher.
Run it as a two-week pilot, not an open-ended project. Score your readiness, fix what’s broken, automate the digest, and measure the actual hours saved before you decide whether to expand. The teams that succeed at this treat the pilot as a test, not a launch.
— Ovannes
See What Gleanit Can Automate for Your Client Reports
Gleanit gives agencies a faster path to trustworthy client reporting than piecing together spreadsheets, connectors, and manual QA every month. Instead of stitching together separate tools for ad monitoring, funnel diagnostics, and report writing, Gleanit brings Meta, TikTok, Google, and LinkedIn data into one connected view and layers AI-assisted narrative generation directly on top of it.
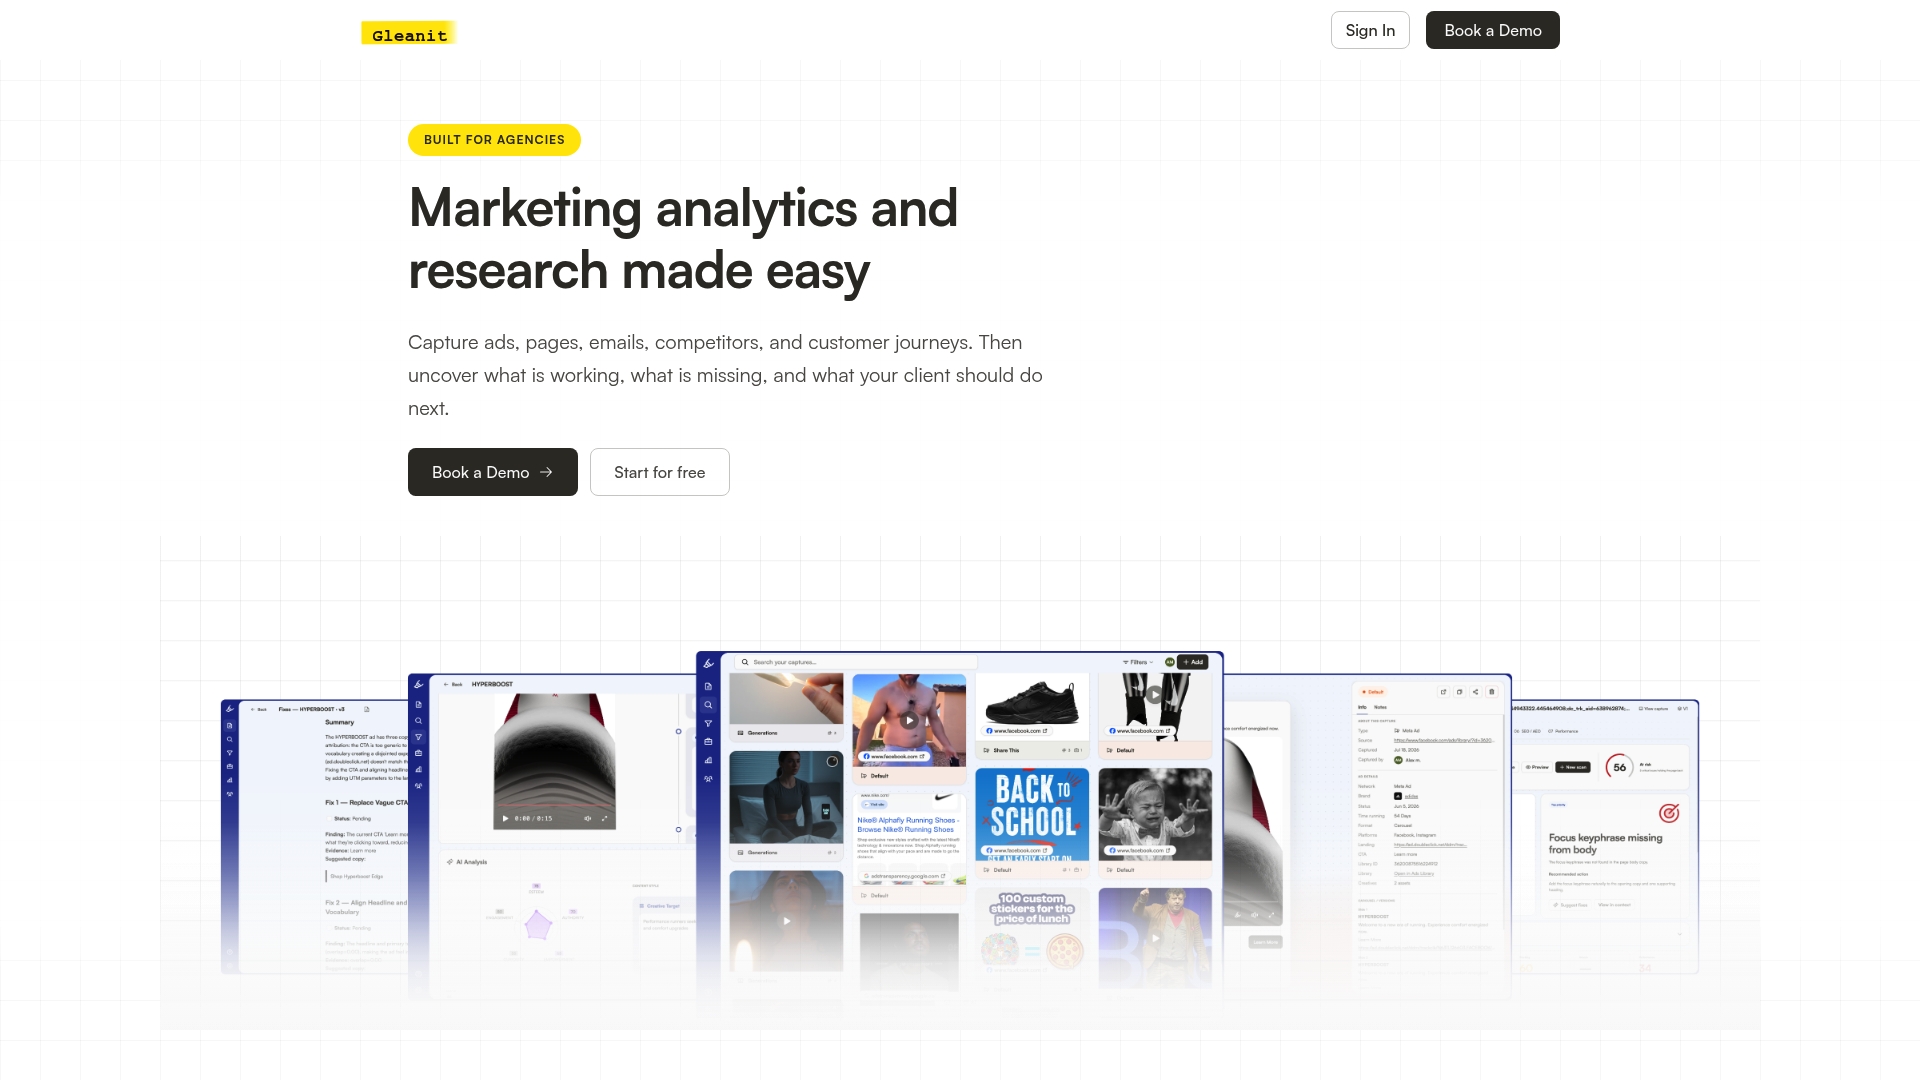
A trial run typically means fewer hours spent manually assembling decks, faster detection of funnel gaps before a client asks about them, and a reporting cadence that updates weekly as new features roll out rather than sitting static for a year. If the readiness scorecard and pilot workflow above sound like the right next step for your team, start a Gleanit trial and configure your first automated client digest this week.
Sources
- Gartner — Data quality topic overview
- Zapier — Marketing analytics automations
- MarketsandMarkets — Marketing automation software market
- Wikipedia — California Consumer Privacy Act
Recommended
- Unified Marketing Dashboard: Faster Insights for Agencies
- Campaign Post Mortem: A Repeatable Agency Template
- Customer Journey Analytics: A Practical Guide for Marketing Teams
Corrections: ovannes@hearye.co or our editorial policy.