
The fastest way to keep clients informed is a concise monthly client-report template paired with automated, live data links. Build one baseline monthly template, layer in channel-specific versions for SEO, paid, social, and email, and share everything through a live link instead of a static PDF whenever the client’s tools allow it.
TL;DR:
- Use live data links for ongoing performance reports like KPI dashboards, while static PDFs are better suited for finished projects or financial records.
- Tailor report templates based on the primary reader, decision urgency, data frequency, and client preferences for dashboards or inbox delivery.
- Structure monthly reports with a clear executive summary, highlights, KPI tables with interpretations, and specific next steps to maintain clarity and trust.
- Build channel-specific templates for SEO, paid media, social media, and email to accurately reflect each channel’s important metrics and visualization methods.
- Automate data collection and layout but keep narrative interpretation manual to ensure reports are understanding-driven and maintain client confidentiality.
Table of Contents
- What Are Client Reporting Templates, and Which Types Do You Need?
- How to Choose the Right Template and Cadence
- The Anatomy of a Best-Practice Monthly Report
- Channel-Specific Report Templates Worth Building
- PDFs, Live Links, or Dashboards: Choosing the Right Format
- Customizing a Template Fast Without Starting Over
- Data Privacy and Confidentiality in Client Reporting
- Publisher Perspective: What Actually Changes When You Standardize
- Automate the Parts a Template Can’t Fix on Its Own
- Sources
What Are Client Reporting Templates, and Which Types Do You Need?
A client reporting template is a pre-built structure for presenting campaign or account performance to a client on a recurring basis. It standardizes what gets measured, how it’s framed, and how often it lands in the client’s inbox, so nobody starts from a blank page every cycle. Most agencies need a handful of these, not one universal document.
Here’s the practical set worth building first:
- Monthly status report. The workhorse. Covers everything happening across an account for the client’s monthly check-in. Best as a live link so the client can revisit it between calls.
- Executive summary report. A one-page, leadership-facing version stripped of jargon. Ideal for stakeholders who never open the full report. PDF works fine here since it’s meant to be forwarded.
- KPI dashboard. A live, filterable view of the metrics that matter most. This should almost always be a link, not a PDF, because stale KPI numbers erode trust fast.
- Campaign performance report. Ties results to a specific initiative (a launch, a seasonal push, a rebrand). Useful as a PDF archive once the campaign ends.
- Paid media report. Spend, efficiency, and creative performance across Meta, Google, TikTok, or LinkedIn. Weekly for active spend, monthly for a rollup.
- SEO report. Rankings, organic traffic, and content performance. Monthly cadence fits SEO’s slower feedback loop.
- Social media report. Reach, engagement, and top-performing content. Biweekly or monthly depending on posting volume.
- Email marketing report. Send volume, open and click rates, and revenue or lead attribution. Monthly, tied to the campaign calendar.
- Financial or budget report. Spend versus contracted budget, pacing, and forecasted burn. Monthly, often PDF for accounting records.
- Post-mortem or wrap-up report. A retrospective after a campaign, project, or quarter closes. Best as a durable PDF, since it’s a historical record, not a living document.
Notice the pattern: anything tracking ongoing performance belongs in a live link. Anything marking a finished chapter, a financial record, or a leadership handoff works better as a static file. That distinction alone solves most of the “which format do I use” debates agencies have internally.
How to Choose the Right Template and Cadence
Picking a template isn’t about grabbing whatever’s prettiest in a gallery. It comes down to five variables: who reads the report, what they’re trying to decide, how often data actually changes, how fresh the data needs to be, and how comfortable the client is with dashboards versus documents. A CMO checking in monthly needs a different document than a founder who wants a Slack ping every Friday.
Before finalizing a template, ask the client (or infer from the contract) these:
- Who is the primary reader, and do they forward this to anyone else?
- What decision does this report need to support, and how urgently?
- How often does the underlying data meaningfully change?
- Does the client actually open dashboards, or do they only read what lands in their inbox?
- What’s the one metric that, if it moved, would trigger a call from the client?
A few rules of thumb keep templates from bloating: cap the executive summary at four sentences, limit the primary KPI table to a manageable number of key metrics., and push anything supplementary into an appendix rather than the main body. Clients skim; a report with 20 metrics up front just gets ignored.
Pro Tip: If a client asks for more metrics than your KPI table can reasonably hold, that’s usually a sign they don’t yet trust the ones you’ve already given them. Fix the trust problem before you fix the table.
The biggest red flag is a template that hasn’t changed in a year despite the account’s goals shifting. If the client pivoted from lead generation to brand awareness, and the report is still leading with cost per lead, the template is actively working against the relationship.
The Anatomy of a Best-Practice Monthly Report
Every strong monthly template follows a similar skeleton, even when the branding and metrics differ by client. Here’s what belongs in each section and how to write it without padding.
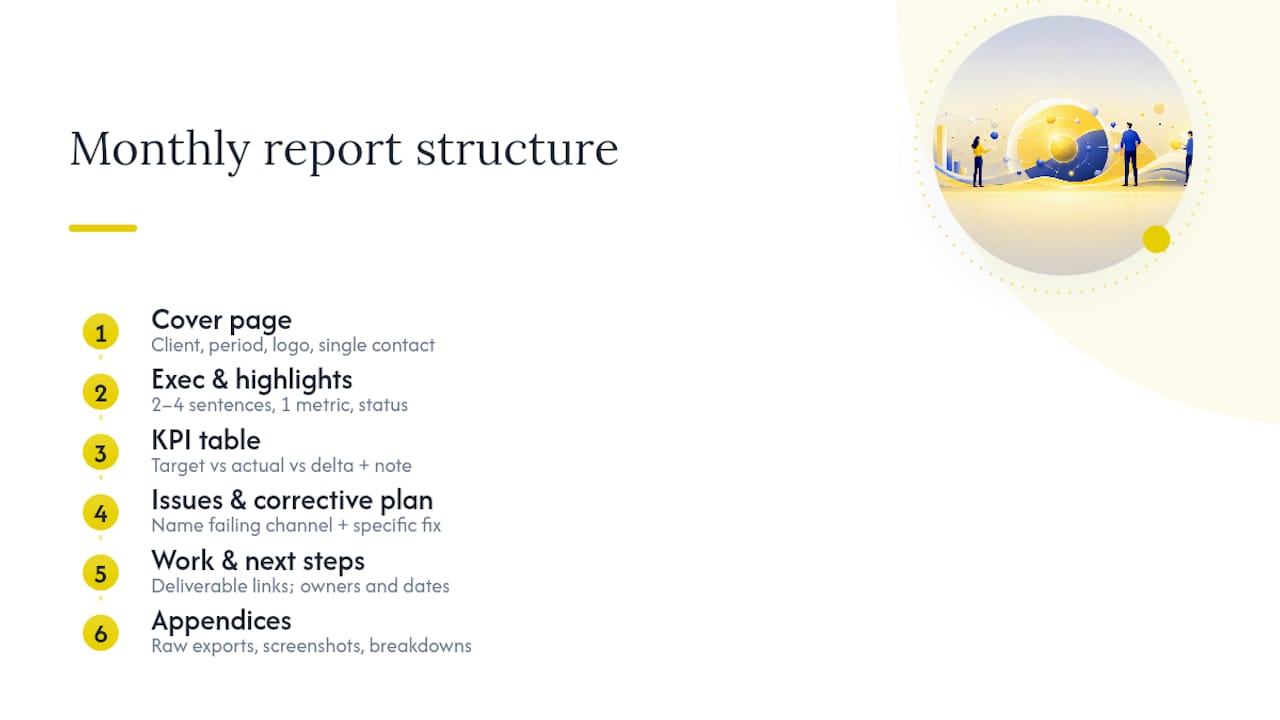
Cover page and metadata. Client name, reporting period, agency logo, and a single point of contact. Nothing more.
Executive summary. Two to four sentences, one headline metric, and a plain statement of whether the account is on track. The account remains on pace to hit the Q2 lead target.
Highlights. Three to five wins worth calling out by name, not buried in a table.
KPI table. This is the section clients actually study. Structure it as target versus actual versus delta, with a one-line interpretation attached to each row rather than a bare number. A table with numbers and no context is the single most common reason clients ask “so, what does this mean?” on every call, according to ProjectManager’s breakdown of client reporting on interpretation-first reporting.
What’s not working, plus a corrective plan. This section does more retention work than any other part of the report. Naming the underperforming channel or tactic and pairing it with a specific fix builds trust that a purely positive report never can, according to ClientVenue’s guidance on monthly report templates.
Work completed, with links. Direct links to deliverables (published posts, live ads, new landing pages) rather than descriptions of them.
Next steps, with owners and dates. Every action item gets a name attached and a date, not a vague “in progress.”
Appendices. Raw data exports, screenshots, or channel-specific breakdowns that support the main narrative without cluttering it.
A useful reference point: a typical free monthly template includes a cover page, executive summary, risk checklist, completed tasks, and appendices as its baseline structure, which lines up closely with what’s outlined above.
Channel-Specific Report Templates Worth Building
Each channel has its own vocabulary and its own version of “so what.” Build a lightweight template per channel rather than forcing every metric into one generic table.
- SEO: organic sessions, keywords ranking in the top 10 and top 3, and leads attributable to organic search. Sample line: “Three target keywords moved into the top 3 this month, adding an estimated 40 organic leads.” Best visualized as a ranking-trend line chart.
- Paid media: spend versus budget, click-through rate, cost per click, conversion rate, and ROAS or cost per acquisition, plus the top-performing creative. Sample line: “Spend tracked 4% under budget while ROAS improved from 2.1x to 2.6x on the retargeting campaign.” A bar chart comparing spend to results by campaign works well here.
- Social media: reach, engagement rate, and the top three posts by link. Sample line: “Reach grew 22% month over month, led by a customer testimonial post that outperformed the account average by 3x.” A ranked list with thumbnails beats a raw table.
- Email: sends, open rate, click-through rate, and conversions. Sample line: “The re-engagement sequence generated 12 qualified leads from a list segment that had been dormant for 90 days.” A funnel visualization showing sends through conversions tells this story fastest.
PDFs, Live Links, or Dashboards: Choosing the Right Format
Static PDFs still have a place. They’re easy to archive, they don’t break when a tool changes its interface, and they work for anything meant as a permanent record, like a post-mortem or a financial statement. Their weakness is that the moment you export one, it starts going stale.
Live links and dashboards solve that problem directly. Sharing a report through a live link or shareable workspace keeps the content current automatically and lets you see whether the client actually opened it, according to Xtensio’s monthly report guidance. That engagement signal alone is worth the switch. Moving from static exports to a live dashboard also cuts the time spent rebuilding the same report every cycle.
A basic automation workflow looks like this:
- Connect a data source (ad platform, analytics tool, CRM) through a saved query or connector so numbers pull automatically.
- Validate the pull against last month’s figures to catch tracking errors before the client sees them.
- Fill in the narrative blocks, the KPI interpretations and the “what’s not working” section, since automation handles numbers, not judgment.
- Schedule delivery and confirm the client’s access, whether that’s an email trigger or a workspace notification.
Pro Tip: Automate the pull and the layout, but never automate the sentence explaining why a number moved. Clients can tell the difference between a report a machine assembled and one a person actually read.
Customizing a Template Fast Without Starting Over
A template only saves time if customizing it doesn’t take as long as writing from scratch. Four things speed that up:
- Branding checklist: client logo, brand colors, a current contact name, and the reporting date, updated once and then locked in place.
- Metrics mapping: match each KPI to the client’s actual stated goal and confirm which data source feeds it, so the table never shows a metric nobody asked for.
- Narrative sentence starters: keep a short bank of openers for wins (“X outperformed target by…”), headwinds (“X underperformed due to…”), and recommended actions (“We recommend…”) so the writing part takes minutes, not an hour.
- Pre-send QA checklist: confirm links work, numbers match the source dashboard, and the executive summary reflects the KPI table before it ever reaches the client’s inbox.
Pulling data first and drafting the KPI section before the narrative tends to produce a cleaner report faster than writing the story first and backfilling numbers.
Data Privacy and Confidentiality in Client Reporting
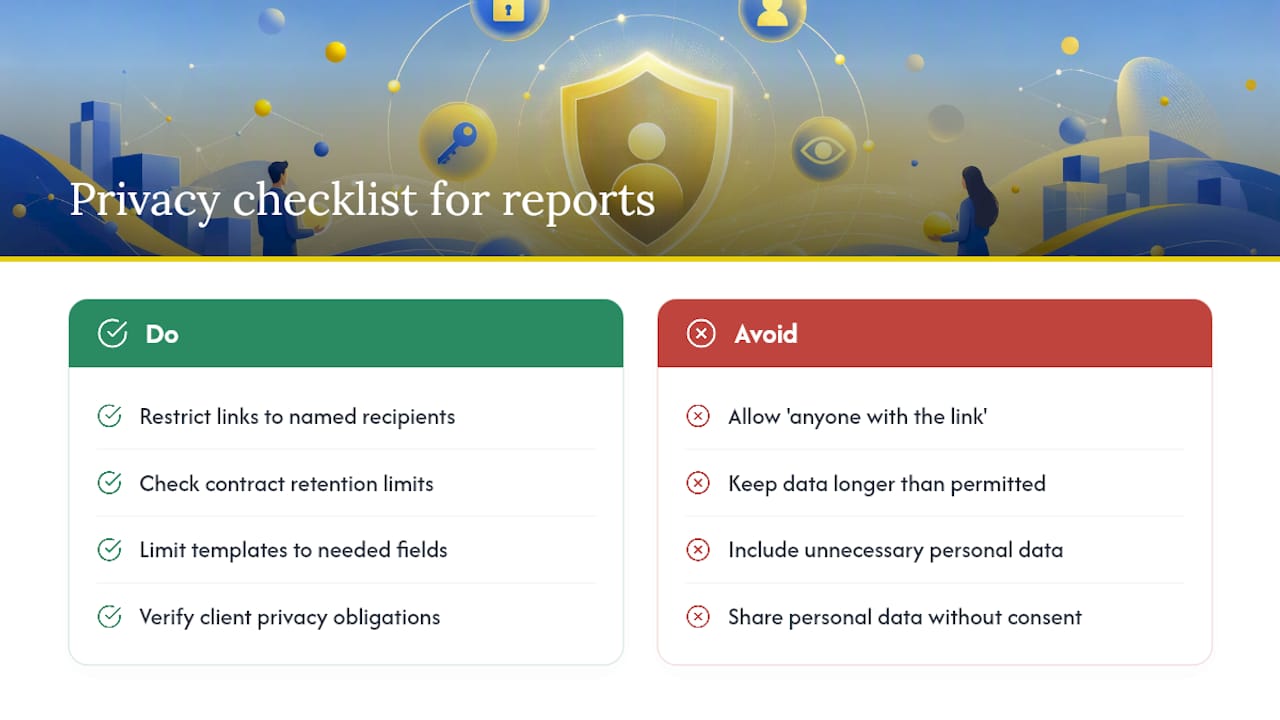
Client reports routinely contain sensitive information: ad spend figures, conversion data tied to real customers, sometimes revenue numbers the client hasn’t disclosed publicly. Treat that data with the same care as any other client asset under contract.
A few baseline practices matter regardless of agency size. Restrict live-link access to named recipients rather than “anyone with the link,” especially when a report includes budget or revenue figures. Confirm what your service agreement or non-disclosure clause actually says about how long you retain client data after an engagement ends, and don’t build a template that pulls more customer-level detail than the report actually needs. If a report touches personal data (email lists, customer names, purchase history), check whether the client’s own privacy obligations, such as those under state privacy laws or sector-specific rules, limit how that data can be displayed or shared outside their organization.
None of this requires a legal department for most agencies. It requires a habit: before a new template goes live, ask whether every field in it needs to be there, and whether the delivery method matches what the contract actually permits. A template that’s lean on unnecessary personal data is also, conveniently, easier for clients to read.
Publisher Perspective: What Actually Changes When You Standardize
Reporting works best when it’s framed as a story about business outcomes, not a metrics dump. Agencies that make this shift tend to notice fewer “what does this mean” emails and faster client sign-off, because the report already answered the question. The real signal that a template is working isn’t how polished it looks. It’s whether turnaround time drops and clarifying calls stop happening. When they don’t, the template is doing its job quietly, which is exactly what it should do.
— Ovannes
Automate the Parts a Template Can’t Fix on Its Own
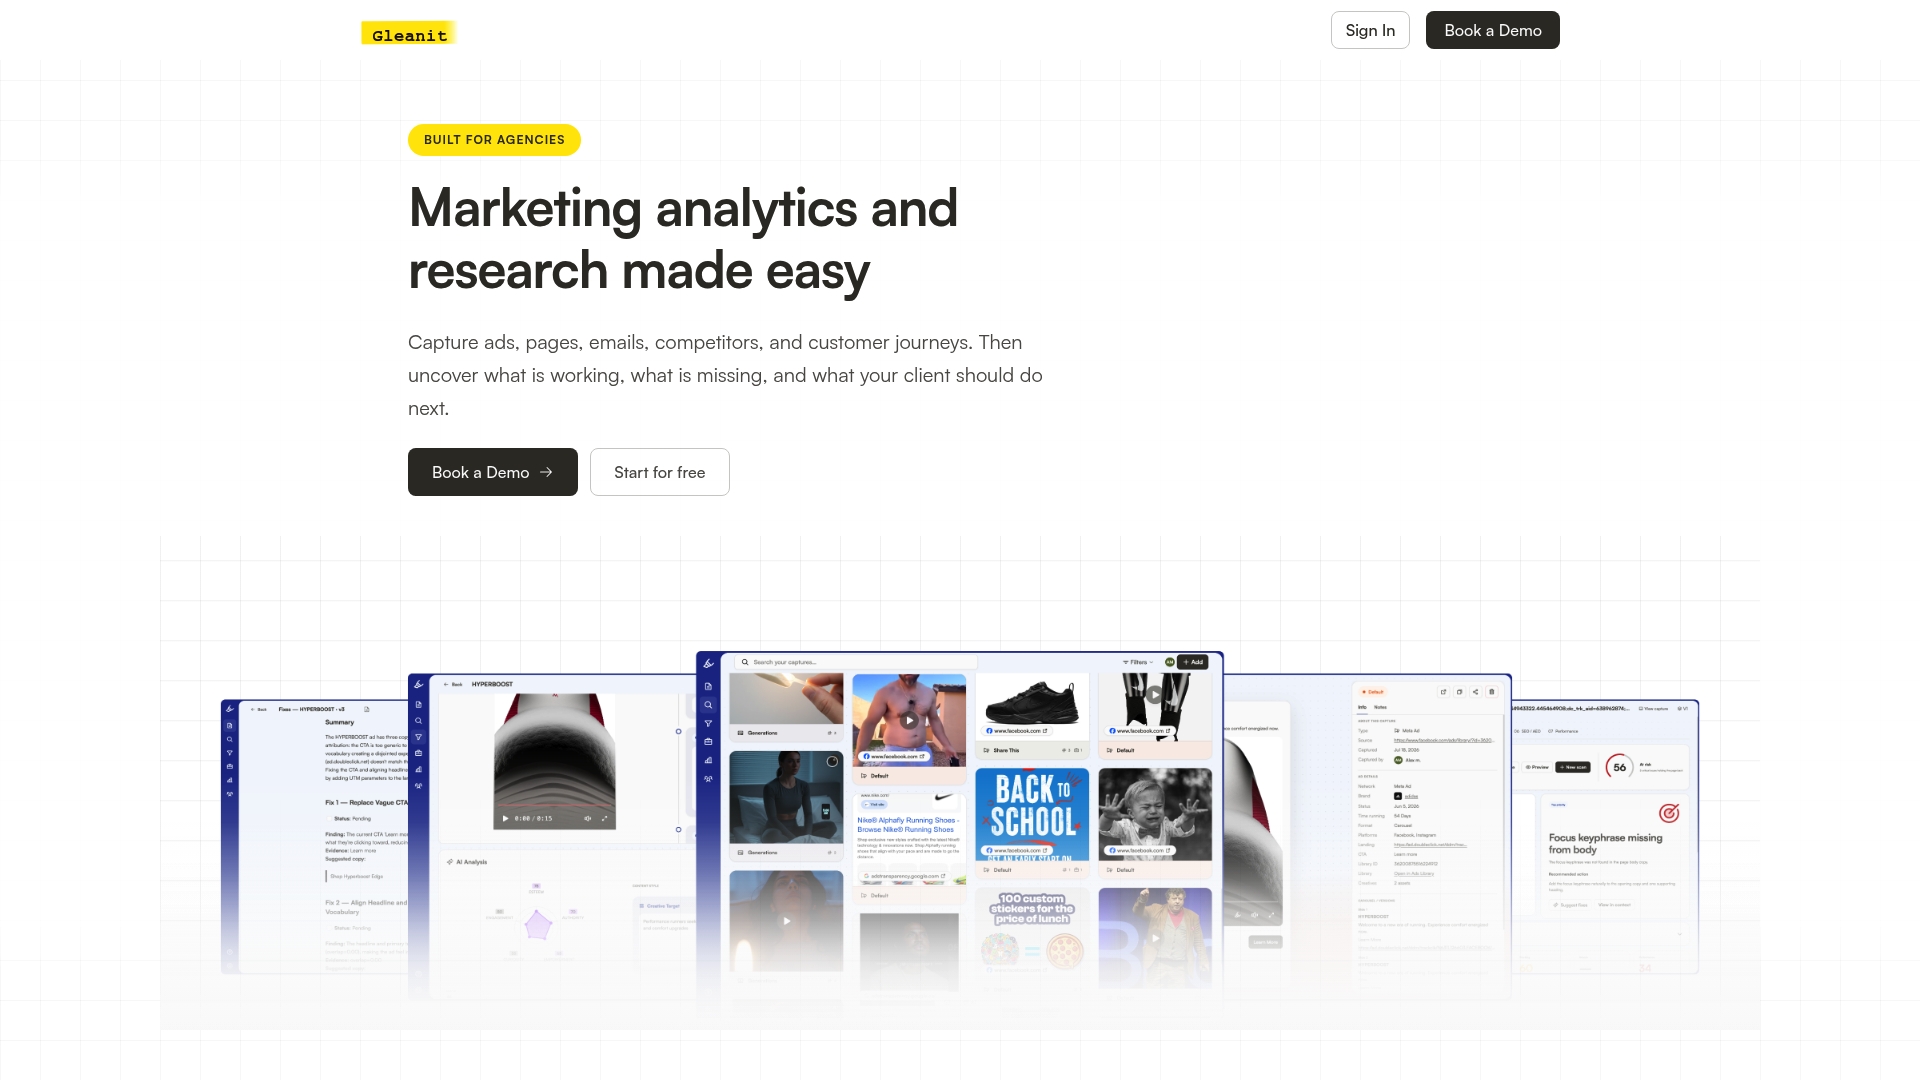
A well-built template still depends on someone manually pulling numbers from four different ad platforms, catching the funnel gap that’s actually costing the client leads, and writing the interpretation that makes the KPI table mean something. That’s where a tool built for agencies changes the math. Gleanit pulls automated monitoring data from Meta, TikTok, Google, and LinkedIn into one connected view, flags funnel gaps before a client asks why conversions dropped, and uses AI to draft the report narrative around your template so you’re editing, not starting cold.
If your team is still copying numbers into a spreadsheet every month, a manual template is costing you hours a client isn’t paying for. A SaaS approach makes more sense once you’re managing more than a couple of accounts or more than two ad platforms per client. Start a free trial at Gleanit and see how much of next month’s report writes itself.
Sources
- Client Reporting: 10 Types of Client Reports (Templates Included)
- Client Report Template for Agencies: Free Monthly Template + What to Include
- Monthly Client Report Template — Free & Editable | Xtensio
Recommended
- Campaign Post Mortem: A Repeatable Agency Template
- Unified Marketing Dashboard: Faster Insights for Agencies
- Monitor Google Ads: A Practical Checklist for Marketers
- Customer Journey Analytics: A Practical Guide for Marketing Teams
Corrections: ovannes@hearye.co or our editorial policy.