
A creative testing framework is a repeatable system for finding and scaling ad winners by replacing gut instinct with structured experiments. Start this week: run a concept test with three distinct creative ideas, measure hook rate and CPA, and scale the winner.
The canonical loop looks like this:
- Hypothesize: Write a specific, falsifiable hypothesis before producing a single asset (e.g., “If we lead with a customer pain point instead of a product feature, CTR will increase by 15%”).
- Build variants: Produce your creative matrix based on the hypothesis, isolating variables for iteration tests and allowing multi-variable differences for concept tests.
- Test: Run in a dedicated testing campaign with a clean audience, defined budget, and fixed duration.
- Analyze: Evaluate diagnostic metrics in order: hook rate first, then hold rate, then CTR, then conversion metrics.
- Scale: Graduate winners into your main scaling campaigns; archive losers with notes on why they failed.
Your 24-hour action: Write one hypothesis for your current top-spending ad, identify the single element you’d change, and brief a variant today. You don’t need a full matrix to start learning.
Key Takeaways
A creative testing framework only produces compounding results when hypothesis quality, metric discipline, and documentation are treated as non-negotiable from the start.
| Point | Details |
|---|---|
| Hypothesis before assets | Write a falsifiable “If X, then Y by Z” hypothesis before producing any creative variant. |
| Metric order matters | Evaluate hook rate first, then hold rate, then CTR, before looking at CPA or ROAS. |
| Spend thresholds are fixed | Reach 10,000 impressions or 1.5–2x target CPA per variant before calling a winner. |
| Dedicate a test budget | Allocate 10–20% of ad spend to a dedicated testing campaign, separate from scaling campaigns. |
| Gleanit for scale | Gleanit’s cross-platform monitoring and AI reporting reduce the manual work of tracking and documenting tests across Meta, TikTok, and Google. |
Table of Contents
- Why creative testing is now the highest-leverage activity in paid media
- Core components of a creative testing framework
- How to set goals, KPIs, and testable hypotheses
- Designing creative variants: what to test and how many to run
- Which testing method fits your hypothesis and traffic volume?
- Test setup, sample size, duration, and stopping rules
- Implementing creative testing at scale: workflows, automation, and governance
- Analyzing and interpreting test results: what the metrics actually tell you
- Optimizing for conversions and scaling winners safely
- Governance, documentation, and building a testing culture
- Agency-grade operational checklist and a worked example
- What experienced teams get wrong (and the fixes that actually work)
- Gleanit gives you the monitoring layer your testing framework needs
- Sources
Why creative testing is now the highest-leverage activity in paid media
Algorithmic platforms have fundamentally shifted where performance lives. Meta, TikTok, and Google’s automated bidding systems handle audience targeting with enough precision that creative has become the primary variable a media team can actually control. Algorithmic platforms increasingly reward creative diversity overprecise audience engineering, making frequent creative testing the highest-leverage activity for many paid teams in 2026.
That shift has a practical consequence: teams that test creatives systematically compound their learning. Every test produces a data point about what resonates with a specific audience at a specific funnel stage. Teams that skip structured testing are essentially running the same experiment over and over without recording the results.
When to prioritize creative testing over other improvements:
- New campaign launches where no historical creative data exists
- Falling ROAS or rising CPA with no obvious targeting or bidding explanation
- Frequency creep (typically above 3–4 on Meta) signaling creative fatigue
- Major product changes, seasonal pivots, or new audience segments
- Post-iOS 14 signal loss where prior conversion data is unreliable
Creative testing is a data-driven process that replaces gut decisions by systematically varying ad elements and measuring which combination performs best on the chosen KPI. The gap analysis that precedes a test is often where the real insight lives: what are you currently not testing, and why?
Core components of a creative testing framework
A framework without all its components tends to collapse at the same point every time: either tests run without clear hypotheses, or winners get scaled without documentation, or the same test gets run twice because nobody recorded the first result. These eight components prevent that.
- Objectives: The business goal the test serves (acquisition, retention, awareness). Every test traces back to one.
- Hypotheses: A written, falsifiable statement in the format “If we change X, we expect Y to change by Z.” No hypothesis, no test.
- Variant taxonomy: A classification system for what type of test you’re running: concept test (distinct ideas), hook test (same concept, different opening), or iteration test (single-variable refinement of a winner).
- Test design: The method you’ll use (A/B, multivariate, holdout), the audience structure, budget split, and duration rules set before launch.
- Metrics dashboard: A live view of diagnostic metrics in priority order: hook rate, hold rate, CTR, conversion rate, CPA/ROAS. One dashboard per test, not buried in platform UI.
- Decision rules: Pre-defined thresholds that determine when to call a winner, iterate, or kill a concept. Written before the test starts, not after you see the numbers.
- Documentation store: A test registry where every completed test lives: hypothesis, variants, results, decision, and next action. This is what turns individual tests into institutional knowledge.
- Governance and roles: Clear ownership of who briefs, who produces, who runs the test, and who calls the result. Without this, tests stall in production or get called early by whoever checks the dashboard first.
The order of operations matters. Set the objective and write the hypothesis first. Then design the test and build variants. Run, measure, decide, and document in that sequence. Skipping the hypothesis step is the single most common reason a test produces data but no learning.
How to set goals, KPIs, and testable hypotheses
The most common mistake in ad creative testing is choosing the wrong metric for the test type. A top-of-funnel concept test judged on CPA will almost always look inconclusive because the conversion signal is too thin. Map your objective to the right metric tier first.
Metric hierarchy: Start with diagnostic metrics that fire early and often (hook rate, hold rate), then move to efficiency metrics (CTR, CPM), and only evaluate profitability metrics (CPA, ROAS) when you have enough conversion volume to trust the signal.
Hypothesis template: “If we [change this specific element], we expect [this metric] to [increase/decrease] by [approximate magnitude] because [the reasoning].”
Examples:
- “If we replace the product-feature headline with a pain-point question, we expect hook rate to increase by 20% because our audience research shows price anxiety is the primary barrier.”
- “If we add captions to the video, we expect hold rate to improve by 15% because 85% of mobile video is watched without sound.”
| Business Objective | Primary Diagnostic Metric | Decision Threshold |
|---|---|---|
| Top-funnel awareness | Hook rate (thumb-stop) | 30%+ hook rate to proceed |
| Mid-funnel engagement | Hold/watch rate, CTR | Hold rate 40%+, CTR above account average |
| Bottom-funnel conversion | CPA, ROAS | CPA within 1.5x target; ROAS above breakeven |
| Creative fatigue diagnosis | Frequency, CPM trend | Frequency above 3.5 or CPM rising 20%+ week-over-week |
Google recommends using campaign experiments and evaluating incremental impressions, clicks, and conversions rather than relying on ad-level CTR alone. That guidance applies broadly: a single metric rarely tells the full story, and the diagnostic metric hierarchy above is what prevents premature decisions.
On platforms with algorithmic allocation (Meta Advantage+, Google PMax), statistical significance in the traditional sense is hard to achieve cleanly.
Designing creative variants: what to test and how many to run
The elements worth testing fall into two categories: structural (concept, format, hook) and executional (copy tone, CTA, captions, color). Structural tests produce bigger swings; executional tests produce refinements. Run them in that order.
Elements to test, roughly in order of expected impact:
- Concept: The core idea or angle (problem/solution, social proof, transformation, entertainment)
- Hook/opening frame: The first 1–3 seconds of video or the primary visual in static
- Format: Video vs. static, carousel vs. single image, short-form vs. long-form
- Copy tone: Direct response vs. conversational vs. educational
- CTA: Button text, placement, urgency framing
- Visual style: UGC-style vs. polished production, lifestyle vs. product-only
- Captions and SFX: On-screen text, subtitles, sound design
Variant matrices and when to use each:
The 3-3-3 matrix (3 concepts × 3 variations × 3 hooks = 27 assets) is a high-volume discovery method that surfaces strong concepts quickly. It requires production capacity and meaningful budget to run effectively. Use it when you’re entering a new market, launching a new product, or have exhausted existing creative directions.

The 3-2-1 matrix (3 concepts × 2 hooks × 1 format variation = 6 assets) fits most mid-size teams. It’s enough variation to find a concept direction without overwhelming production.
Iterative isolation (one winner, one changed variable) is the right choice after a concept test has identified a direction. Change one element at a time: swap the hook, test a new CTA, try captions on/off. Two dominant framework patterns in practice are concept-first and iterative isolation; choose based on production capacity and spend volume.
Clean experiment checklist:
- Concept tests: multiple variables allowed (you’re comparing distinct ideas, not isolating causes)
- Iteration tests: one variable changed per test, everything else held constant
- Audience: fresh segment not exposed to previous test variants
- Budget: equal split across variants, or dedicated testing campaign with fixed daily spend
Pro Tip: When production capacity is constrained, prioritize hook tests. The hook is the highest-leverage variable in video creative, and a hook test requires only re-editing the first three seconds of an existing asset, not producing from scratch.
Which testing method fits your hypothesis and traffic volume?
The method you choose determines what you can learn, how fast, and how much you can trust the result. Pick based on hypothesis clarity and available traffic, not on what the platform makes easiest.
A/B testing isolates one variable between two variants. It’s the most interpretable method and the right default for iteration tests. The trade-off: you need enough traffic to reach significance on each variant, and platform algorithms can skew spend toward an early leader before the test is conclusive.
Multivariate testing tests multiple elements simultaneously and measures interactions between them. It requires significantly more traffic and production assets, but it can surface non-obvious combinations (a specific hook works better with a specific CTA). Use it only when you have the volume to support it.
Lift/holdout testing measures incrementality by comparing a test group exposed to the creative against a holdout group that sees no ad or a control ad. It’s the most accurate method for measuring true impact, especially post-IDFA where attribution is noisy. Qualitative research for early-stage concept validation combined with quantitative testing for scale is a pattern that mirrors this: validate direction qualitatively, then confirm at scale with a holdout.
Multi-armed bandits (adaptive allocation) shift budget toward better-performing variants in real time. They find winners faster but sacrifice learning precision. Use them for optimization, not for controlled experiments where you need clean data.
| Method | Speed to Decision | Precision | Production Load | Platform Bias Risk |
|---|---|---|---|---|
| A/B test | Medium | High | Low | Medium (algorithm skew) |
| Multivariate | Slow | High | High | Medium |
| Lift/holdout | Slow | Very high | Low | Low |
| Multi-armed bandit | Fast | Low | Low | High |
Platform-specific caveats:
- Meta: Use dedicated testing campaigns (not Advantage+ Shopping) to prevent algorithmic reallocation from skewing results. Meta’s built-in A/B test tool controls for audience overlap but limits flexibility.
- Google PMax: You can’t run traditional A/B tests within a single PMax campaign. Create separate asset groups per concept to approximate concept tests, since PMax ranks assets and allocates budget algorithmically.
- TikTok: Use TikTok’s Creative Testing tool for split tests, but note that TikTok’s algorithm accelerates spend toward early winners faster than Meta, so minimum duration rules matter more here.
- SKAN4/post-IDFA flows: On iOS, conversion signals are delayed and aggregated. Run tests longer (minimum 14 days), use modeled conversions as a directional signal, and weight hook and hold rate more heavily than downstream conversion data.
Pro Tip: On Meta, run your test in a Campaign Budget Optimization (CBO) campaign with a single ad set per variant rather than using the native split-test tool. This gives you cleaner budget control and prevents the algorithm from collapsing spend onto one variant before you’ve hit your impression threshold.
Test setup, sample size, duration, and stopping rules
The decision rule comes first. Before you launch, write down exactly what will make you call a winner: which metric, at what threshold, with how much spend behind it. Teams that skip this step end up calling tests based on whoever checks the dashboard on a good day.
Sample size and spend thresholds:
Minimum thresholds before judging a variant:
- Impressions: 10,000 per variant as a floor for diagnostic metrics (hook rate, CTR).
- Conversions: 50 conversions per variant before evaluating CPA or ROAS.
- Spend: 1.5–2x your target CPA per variant before drawing conclusions on conversion efficiency.
- Time: Minimum 7 days to account for day-of-week variation; 14 days on iOS/SKAN4 flows.
Minimum thresholds like 10,000 impressions or 1.5–2x target CPA are the practical guardrails that prevent premature decisions. When conversions are sparse (low-volume accounts, high-ticket products), weight diagnostic metrics more heavily and extend the test duration rather than lowering the conversion threshold.
Recommended test durations:
- Algorithmic platforms need a warm-up period of 3–5 days before spend stabilizes. Don’t read results in the first 72 hours.
- Standard test duration: 7–14 days for most paid social campaigns.
- Extended duration: 14–21 days for iOS-heavy audiences, high-ticket products, or low daily spend.
Stopping rules checklist:
- Statistical threshold reached (80% directional confidence for iteration tests; 95% for holdout tests)
- Spend threshold reached (1.5–2x target CPA per variant)
- Performance divergence is clear and stable for 5+ consecutive days
- Platform has reallocated 80%+ of spend to one variant (a signal, not a conclusion)
- Budget exhausted before thresholds: record as inconclusive, note required spend for a rerun
Statistic callout: The 10,000-impression and 1.5–2x CPA thresholds are practitioner standards, not platform-mandated minimums. On high-CPM platforms or niche B2B audiences, reaching 10,000 impressions per variant may require a larger dedicated test budget than teams expect. Plan for it before launch.
| Threshold Type | Minimum Value | Notes |
|---|---|---|
| Impressions per variant | 10,000 | Floor for diagnostic metrics only |
| Conversions per variant | 50 | Required before judging CPA/ROAS |
| Spend per variant | 1.5–2x target CPA | Adjust up for high-ticket products |
| Test duration | 7 days minimum | 14 days for iOS/SKAN4 or sparse conversion |
Implementing creative testing at scale: workflows, automation, and governance
Scale requires automation and clear ownership. A team where anyone can call a test, anyone can stop it, and results live in someone’s personal spreadsheet will not compound learning over time. The infrastructure is as important as the methodology.
Standard workflow:
- Intake brief: Creative lead writes hypothesis, defines variant taxonomy, and specifies the test type (concept/hook/iteration).
- Production matrix: Design team produces assets per the brief; QA checks naming conventions and tracking tags before upload.
- Test campaign setup: Media owner launches in a dedicated testing campaign, confirms budget split, sets duration and stopping rules in the test registry.
- Live monitoring: Analyst checks diagnostic metrics at day 3 (warm-up check), day 7 (mid-point), and at the defined decision date.
- Result recording: Analyst records outcome in the test registry with hypothesis verdict, metric results, and recommended next action.
- Winner graduation: Media owner replicates winning variant into the scaling campaign; creative lead briefs the next iteration test based on the result.
Prioritization matrix for test sequencing:
Run concept tests first (highest potential impact, highest uncertainty), then hook tests on winning concepts (medium impact, lower production cost), then iteration tests on proven hooks (lower impact, lowest cost). This order maximizes learning per dollar spent.
Governance roles:
- Creative lead: Owns hypothesis quality, variant taxonomy, and creative brief.
- Media owner: Owns campaign structure, budget allocation, and stopping rules.
- Analyst: Owns the metrics dashboard, result interpretation, and test registry.
- QA: Confirms naming conventions, tracking, and audience exclusions before launch.
Best practice is to write a hypothesis before producing assets, isolate one variable per iteration test, and allocate 10–20% of ad spend to a dedicated testing budget.
Pro Tip: Use asset naming conventions that encode the test ID, variant type, and hypothesis number directly in the file name (e.g., T047_CONCEPT_A_painpoint-hook). This makes it possible to filter results in any dashboard without relying on manual tagging.
Enterprise teams should run concept tests to find broad winning directions, then hook and variation tests to refine those winners, with a cadence of 2–4 new concepts per week for high-volume teams. For most mid-size agencies, one to two new concepts per week is a realistic and sustainable pace.
Analyzing and interpreting test results: what the metrics actually tell you
Reading results in the wrong order is how teams make bad decisions with good data. The diagnostic metric hierarchy exists because each metric answers a different question about where the creative is succeeding or failing.
- Hook rate (thumb-stop rate): Did the creative stop the scroll? A low hook rate means the opening frame or first second of video isn’t compelling enough. Fix the hook before evaluating anything downstream.
- Hold/watch rate: Did viewers stay? Low hold rate with a good hook means the body of the creative isn’t delivering on the opening promise.
- CTR: Are engaged viewers clicking? Low CTR after good hold rate usually points to a weak CTA or a disconnect between the creative message and the landing page offer.
- Conversion rate: Are clicks converting? If CTR is healthy but conversion rate is low, the problem is likely post-click (landing page, offer, price), not the creative.
- CPA/ROAS: Is the creative profitable at scale? This is the final verdict, but it’s meaningless without the context of the metrics above.
Reading platform allocation signals:
Early algorithmic preference can reflect recency bias, audience overlap, or auction dynamics rather than genuine creative superiority. Wait for the impression threshold before calling the test.
Interpretation examples:
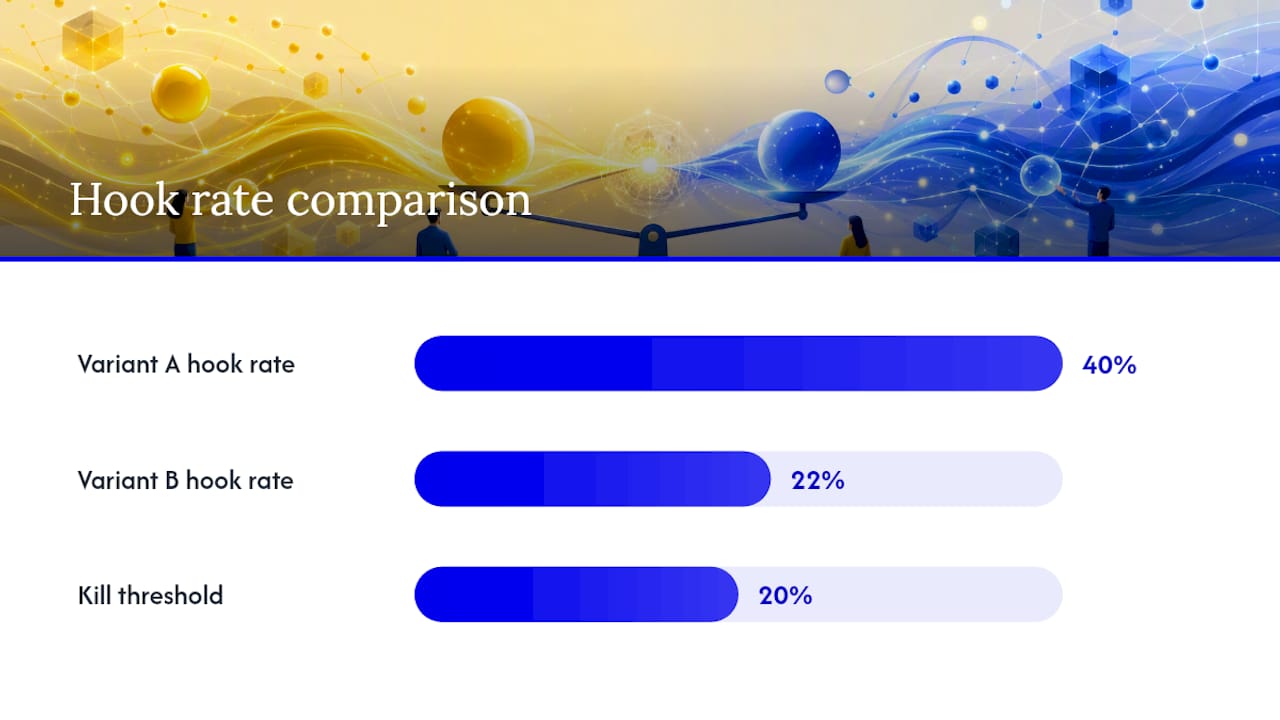
- Variant A has a 40% hook rate, Variant B has 22%: Variant A wins the opening. Run a hold rate check before scaling.
- Variant A has higher hook rate but lower CTR than Variant B: The hook is working but the body or CTA isn’t converting interest into clicks. Consider a hybrid: Variant A’s hook with Variant B’s CTA.
- Both variants have similar metrics but one costs 30% less per conversion: Scale the efficient one, but don’t kill the other. Run an iteration test to understand why the cost difference exists.
Decision rules:
- Graduate a winner: Thresholds met, clear metric advantage on two or more diagnostic metrics, result stable for 5+ days.
- Iterate: One metric is better, others are flat. Change the underperforming element and retest.
- Kill a concept: Hook rate below 20%, no metric advantage after full spend threshold, or hypothesis clearly disproven.
Pro Tip: After five or more completed tests, run a cross-test pattern analysis: which hooks consistently outperform regardless of concept? Which formats show up in every winner? These cross-test patterns are more durable than any single test result and should feed directly into your creative brief template.
Optimizing for conversions and scaling winners safely
Moving a winner from a test campaign into a scaling campaign is where most teams either leave money on the table or blow up their CPA. The transition needs to be deliberate.
Immediate scaling steps:
- Replicate the winning variant into your scaling campaign as a new ad (don’t just increase budget on the test campaign, which disrupts the test’s data integrity).
- Increase budget gradually: no more than 20% per day to avoid triggering the algorithm’s learning phase reset.
- Keep a control ad in rotation alongside the new winner. If the winner degrades, you have a fallback without a gap in delivery.
- Verify tracking, attribution window, and campaign objective alignment before the budget move. A winner tested under a 7-day click attribution window behaves differently under a 1-day view window.
Creative refresh guidelines:
Enterprise teams use a 60/30/10 creative mix: 60% of spend on proven winners, 30% on remixes of those winners (format swaps, localization, new hooks on the same concept), and 10% on entirely new concepts. This model manages fatigue while keeping discovery velocity alive.
Refresh triggers to watch for:
- Frequency above 3.5 on Meta
- CPM rising more than 20% week-over-week without bid changes
- Hook rate declining 15%+ from the creative’s peak performance
- A new concept test winner outperforming the current control by more than 20% on CPA
Remix strategies for extending winner lifespan:
- Format swap: convert a winning video into a static carousel or a story-format vertical
- Localization: adapt copy and visuals for a new geographic market or demographic segment
- Hook refresh: keep the winning body and CTA, test three new opening frames
- Length variation: cut a 30-second winner to 15 seconds for a different placement
Account-level considerations: Watch for audience saturation when scaling. A creative that performs well at $500/day may show frequency-driven fatigue at $3,000/day if the audience size hasn’t expanded proportionally. Align bid strategy with creative strengths: a creative that drives strong view-through behavior pairs better with a reach or video-view objective at scale than with a conversion objective that optimizes for a narrower signal.
Governance, documentation, and building a testing culture
The difference between a team that runs tests and a team that actually learns from them is documentation. Without a shared record, every new team member starts from zero, and every test that fails gets forgotten instead of informing the next hypothesis.
Documentation checklist:
- Test registry: A shared log of every test run, including hypothesis, variant descriptions, results, decision, and next action. One row per test, accessible to everyone on the team.
- Creative playbook: A living document that captures proven creative principles derived from test results: which hooks work for which audiences, which formats outperform by funnel stage, which CTAs convert.
- Swipe file: A curated library of winning ads, organized by concept type, format, and performance tier. Used to brief new variants and onboard new team members.
Suggested cadences:
- Weekly creative review: 30 minutes, media owner and creative lead review active tests, check diagnostic metrics, flag any tests approaching decision thresholds.
- Monthly insight synthesis: 60 minutes, full team reviews the past month’s completed tests, updates the creative playbook, and sets the next month’s testing priorities.
Common cultural pitfalls and how to avoid them:
- Reactive testing: Running tests in response to a bad week rather than from a planned hypothesis backlog. Fix: maintain a rolling list of 5–10 prioritized hypotheses at all times.
- Hypothesis-free tests: Producing variants without a written hypothesis because “we’ll see what happens.” Fix: make the hypothesis a required field in the creative brief template.
- Poor creative-to-media handoff: Creative team produces assets without knowing the test structure; media team launches without understanding the hypothesis. Fix: the creative lead and media owner co-sign the brief before production starts.
Agency-grade operational checklist and a worked example
10-point pre/during/post-test checklist
- Brief and hypothesis: Written hypothesis in the “If X, then Y by Z” format, signed off by creative lead and media owner.
- Variant taxonomy confirmed: Test classified as concept, hook, or iteration; variable isolation rules applied.
- Assets produced and QA’d: Naming convention applied, tracking tags verified, creative specs confirmed per platform.
- Test campaign structure: Dedicated testing campaign, one ad set per variant (or equivalent), equal budget split confirmed.
- Audience setup: Fresh audience segment, exclusions applied to prevent overlap with scaling campaigns.
- Decision rules documented: Metric thresholds, spend thresholds, and duration written in the test registry before launch.
- Dashboard live: Diagnostic metrics visible in a shared dashboard; warm-up check scheduled for day 3.
- Mid-point check: Day 7 review; flag any platform reallocation signals or anomalies.
- Result recorded: Hypothesis verdict, metric results, and next action logged in the test registry.
- Winner graduated or concept killed: Scaling campaign updated; creative playbook updated with the insight.
Worked example: concept-first test feeding into scale
Account context: DTC supplement brand, $15,000/month Meta budget, target CPA $45, current creative showing frequency creep at 3.8.
Step 2 — Variant matrix (3-2-1): Three concepts (transformation story, social proof/testimonial, product feature control) × two hooks each × one format (15-second video). Six assets total.
Not calling it yet; impression threshold not reached.
Winner: transformation story concept.
Step 6 — Scale: Winning variant replicated into scaling campaign. Control ad kept in rotation. Hook test briefed for next cycle: three new opening frames on the transformation story concept.
Step 7 — Documentation: Test logged in registry. Creative playbook updated: “Transformation/aspiration angle outperforms product specification for [audience segment] on Meta. Replicate in next TikTok concept test.”
Combining qualitative research for early-stage concept validation with quantitative testing for scale is a pattern that mirrors this workflow: the audience research that informed the hypothesis is qualitative; the test that confirmed it is quantitative. Both steps matter.
Gleanit’s automated monitoring and cross-platform dashboards can surface the diagnostic metrics and frequency signals described in this workflow without manual platform-by-platform checks, which is particularly useful when running parallel tests across Meta, TikTok, and Google simultaneously.
What experienced teams get wrong (and the fixes that actually work)
The most common errors in creative testing aren’t technical. They’re structural: bad hypotheses, premature stopping, and contaminated audiences. Each one is fixable with a small process change.
Bad hypotheses are the root cause of most inconclusive tests. A hypothesis like “let’s try a different visual” isn’t testable. It doesn’t specify what metric should move or by how much. When the test ends, you have data but no learning. The fix is mechanical: require the “If X, then Y by Z because [reasoning]” format as a non-negotiable field in the brief. If someone can’t fill it in, the test isn’t ready to run.
Premature stopping is almost always driven by anxiety. A variant looks like it’s losing on day 4, someone pauses it, and the team never finds out whether it would have recovered after the warm-up period. The fix: lock the stopping rules before launch and give only one person the authority to call the test early, with a documented reason.
Mixing audiences is the subtler problem. Running a test on an audience that’s already been exposed to previous variants of the same creative contaminates the result. The new variant is competing against memory of the old one, not against a clean baseline. Avoid exposing your test audience to unrelated ads and use fresh audiences per round when accuracy matters. In practice, this means maintaining a dedicated exclusion list of audiences that have seen any variant in the current test cycle.
The opening wasn’t stopping the scroll, but the people who did watch were highly engaged. The fix: run a new test with a stronger opening frame on the same body content. The “failing” test wasn’t a failure; it was a signal that the body was strong and the hook was the bottleneck.
The teams that learn fastest aren’t the ones running the most tests. They’re the ones extracting the most signal from each test, including the ones that look like losses.
Gleanit gives you the monitoring layer your testing framework needs
Running a creative testing framework at scale means tracking diagnostic metrics across Meta, TikTok, and Google simultaneously, flagging frequency signals before they become fatigue problems, and keeping a test registry that doesn’t live in someone’s personal spreadsheet.
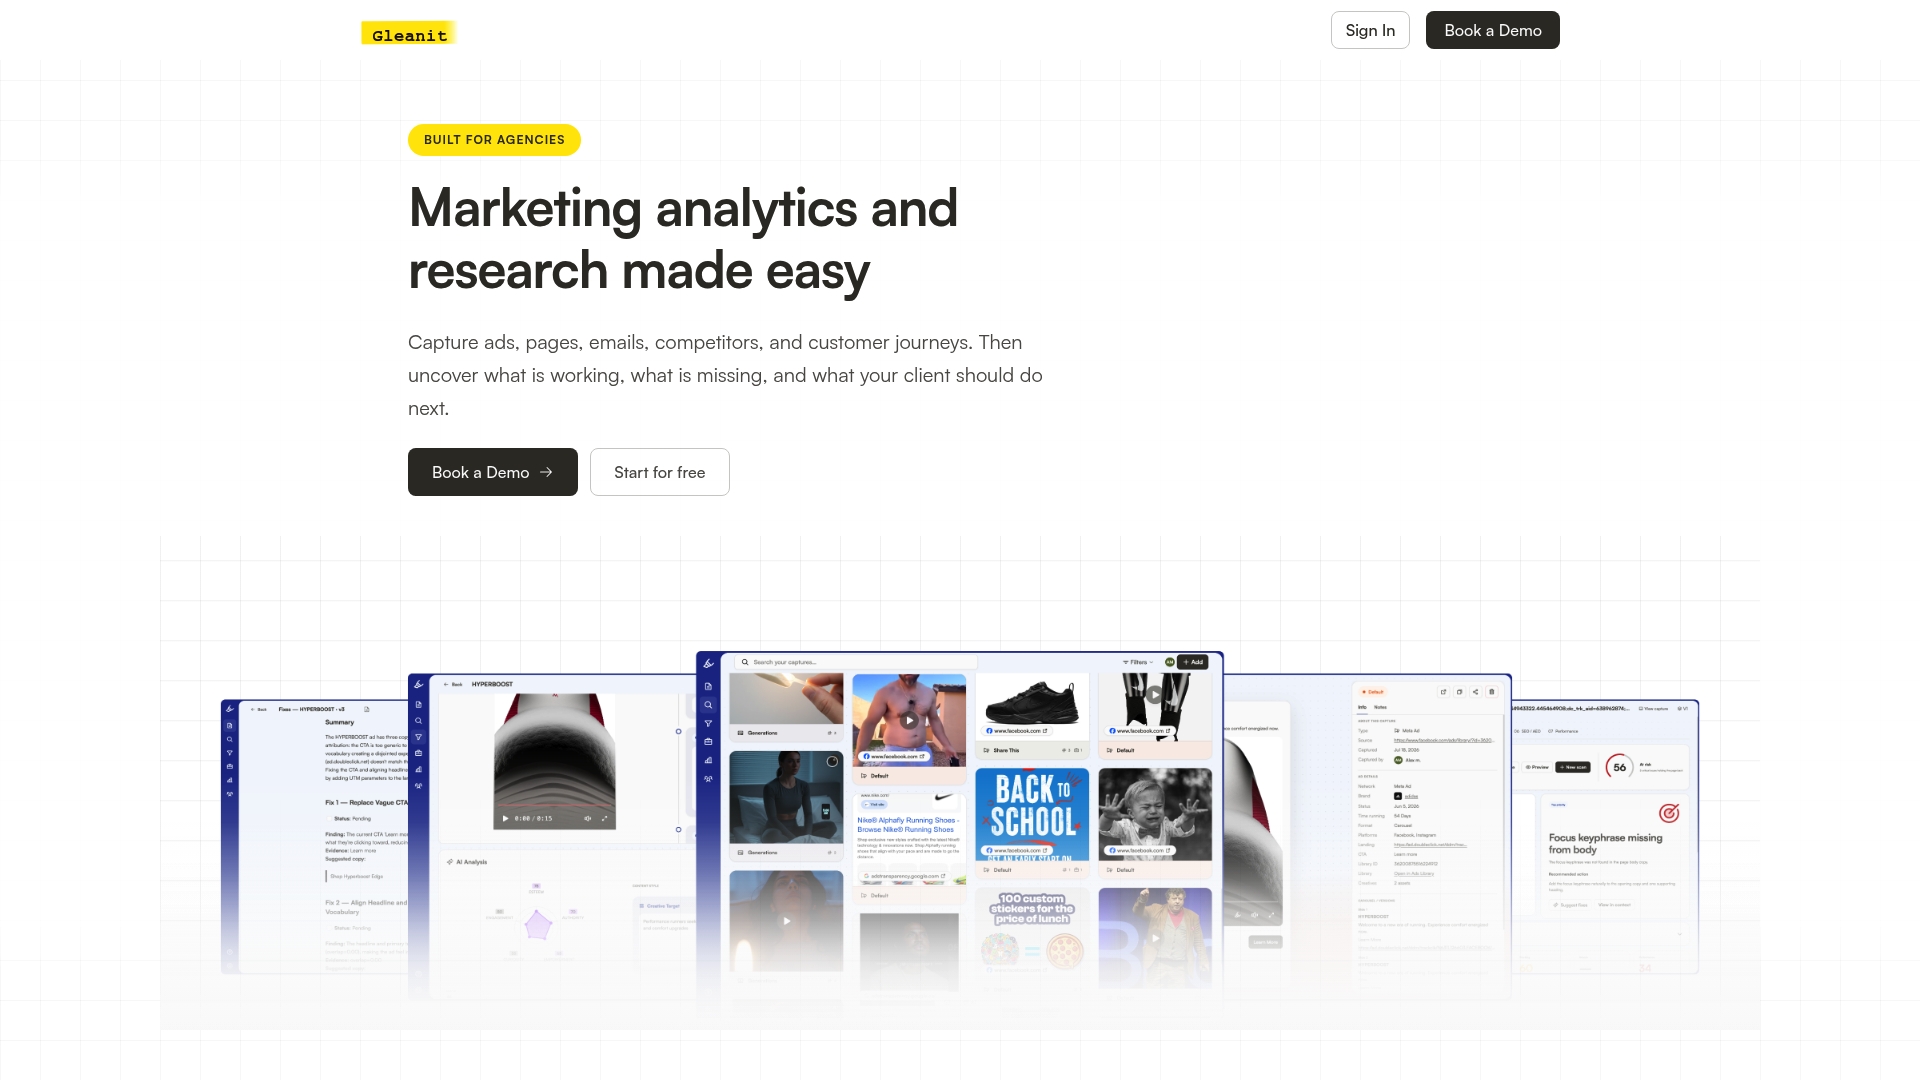
Gleanit’s automated ad monitoring and cross-platform dashboards bring all of that into one connected view. The platform captures ads and customer journeys across Meta, TikTok, Google, and LinkedIn, identifies funnel gaps, and surfaces prioritized fixes so your team spends time acting on insights rather than hunting for them. AI-powered report generation means your test results and creative performance data are documented and shareable without manual compilation. For agencies managing multiple client accounts, dedicated client workspaces and integrations with Slack, Discord, and Figma keep creative testing workflows connected across the full team.
When your testing volume grows past two or three simultaneous tests, manual monitoring across platforms becomes the bottleneck. That’s when a tool like Gleanit pays for itself. Start a free trial and see how much faster your team can move from test result to scaled winner.
Sources
- Creative testing explained — AppsFlyer
- Creative Testing for Paid Ads: A 2026 Playbook · Tadka
- Creative Testing Framework for Paid Social on Enterprise Teams (2026) · Superside
- Creative Testing: Definition, Methods, and Best Practices | Outset
- Google Ads help: Testing ads — Google Support
- Meta Creative Testing Framework: The 3-3-3 Approach to Finding Winners · Pilothouse Digital
Recommended
Article generated by BabyLoveGrowth
Corrections: ovannes@hearye.co or our editorial policy.