
Cross-channel attribution assigns credit to every touchpoint in a customer’s journey across paid, owned, and earned channels. The single most important thing to do first: fix your data architecture before touching any model. Centralize signals into a unified store, resolve identity across devices, then layer in a model mix and validate with incrementality experiments. The IAB Cross-Channel Measurement Best Practices Playbook frames this as a data-architecture problem first and a modeling problem second; that ordering matters more than which attribution model you eventually pick. GA4’s data-driven attribution and tools like Amazon Ads’ cross-channel reporting are useful reference points, but neither replaces a clean data foundation.
Key Takeaways
Cross-channel attribution works when data architecture, identity resolution, and model governance are treated as prerequisites, not afterthoughts.
| Point | Details |
|---|---|
| Fix data architecture first | Centralize all channel signals into a warehouse before selecting any attribution model. |
| Enforce UTM discipline | A UTM governance doc enforced at campaign launch prevents months of corrupted attribution data. |
| Layer your measurement methods | Combine MTA for known users, MMM for offline coverage, and incrementality tests for causal validation. |
| Validate with experiments | Run holdout tests quarterly; model outputs are hypotheses until tested against real withheld audiences. |
| Gleanit for unified visibility | Gleanit’s automated journey monitoring and funnel diagnostics reduce the data-architecture work that blocks attribution progress. |
Table of Contents
- What is cross-channel attribution and why does it matter?
- How cross-channel attribution works end-to-end
- Which attribution model should you use?
- What are the biggest challenges in cross-channel attribution?
- Step-by-step playbook: how to implement cross-channel attribution
- Which approach fits your business scenario?
- How to validate your attribution: experiments and model benchmarking
- The part most attribution guides skip
- Gleanit connects your attribution data in one place
- Sources
What is cross-channel attribution and why does it matter?
Most marketing teams still measure each channel in isolation. Google Ads reports its conversions. Meta reports its own. Email reports its own. Adding them up leads to an inflated total because every channel claims the same customer. That’s not attribution; it’s channel-level self-reporting dressed up as measurement.
Cross-channel attribution solves this by connecting exposure data across all channels, deduplicating reach, and calculating each channel’s incremental contribution to a conversion. The business decisions that depend on getting this right are significant:
- Budget allocation: Which channels get more spend next quarter?
- Creative optimization: Which ad formats and messages move customers through the funnel?
- Channel mix planning: Are you over-indexed on bottom-funnel paid search while ignoring the display and video that primed those clicks?
- Forecasting: How does a 20% cut to one channel affect total revenue?
The stakes are real. Amazon Ads’ cross-channel attribution research shows that channel combinations, particularly display paired with video, can produce material incremental lift in full-funnel comparisons. An HBR study of 46,000 shoppers confirmed that omnichannel approaches deliver measurable improvements in customer outcomes, supporting the business case for unified measurement.
The misattribution problem is particularly damaging for paid search. Last-click models routinely inflate paid search ROAS because search captures intent that was built by earlier touchpoints, often display, social, or email. You cut those “underperforming” upper-funnel channels, search ROAS drops, and you never understand why.
How cross-channel attribution works end-to-end
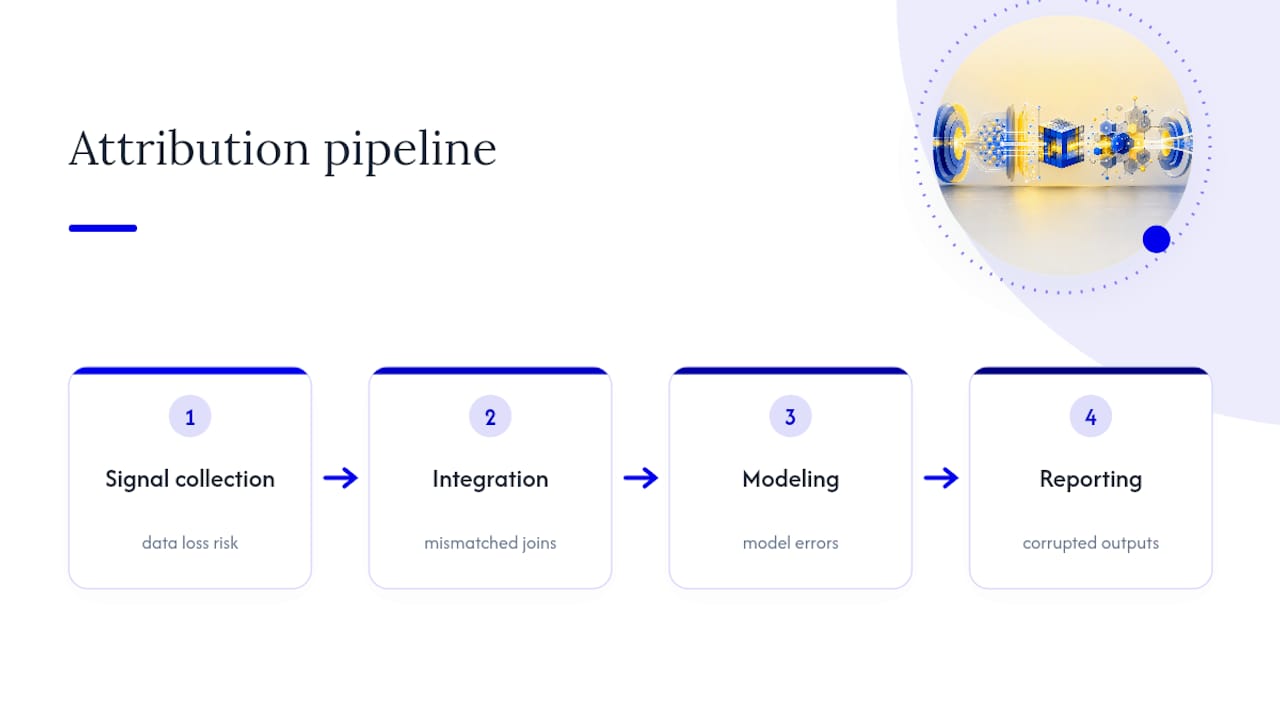
The pipeline has four stages: signal collection, integration, modeling, and reporting. Each stage has its own failure modes, and a gap at any stage corrupts everything downstream.
Signal collection
You need event-level data from every channel that touches a customer. That includes:
- Digital paid: click and impression logs from Google, Meta, TikTok, LinkedIn, programmatic DSPs
- Owned channels: email opens, clicks, on-site behavior, app events
- CRM events: lead status changes, offline purchases, renewal signals
- Offline and retail: in-store transactions, call center conversions, point-of-sale data matched to loyalty IDs
The challenge is that each source uses its own schema, timestamp format, and identifier. A Meta impression log uses a different user ID than your CRM, which uses a different one than your email platform.
Integration: ETL, warehousing, and naming conventions
This is where most attribution projects stall. Raw signals need to flow into a central data warehouse (BigQuery, Snowflake, Redshift are common choices) through an ETL or reverse-ETL pipeline. Before any modeling happens, you need:
- A consistent UTM taxonomy enforced across every campaign and channel
- A canonical event schema so that a “purchase” event from Shopify and a “conversion” event from GA4 map to the same record type
- Timestamp normalization (UTC everywhere, no exceptions)
- A clear definition of what counts as an impression versus a click for each channel
Pro Tip: Build a UTM governance doc and make it a required step in your campaign launch checklist. A single rogue campaign without UTMs can create a ghost traffic source that contaminates your model for months.
Identity resolution
Before you can stitch a journey, you need to know that the person who saw a display ad on Tuesday is the same person who clicked a paid search ad on Thursday and converted on Saturday. Identity resolution using email or CRM anchors for known users is the most reliable approach. For unknown users, probabilistic matching (device fingerprinting, IP-based inference) fills gaps but introduces noise.
Deterministic resolution is accurate but limited to logged-in or identified users. Probabilistic resolution extends coverage but degrades precision. Most mature stacks use both: deterministic for the known-user population, probabilistic for the anonymous remainder.
Model application and reporting
Once signals are centralized and identities are stitched, models run against the unified dataset to assign credit. Outputs feed dashboards and budget-planning tools. The flow looks like this: raw signals → central data store → identity stitching → attribution model → reporting layer → budget decisions. Each arrow is a potential failure point, which is why governance matters as much as model selection.
Which attribution model should you use?
There is no universally correct answer, and any vendor who tells you otherwise is selling you their default. The right model depends on your journey length, conversion volume, and what question you’re actually trying to answer.
Single-touch models
First-click gives all credit to the first touchpoint. Useful for understanding what drives awareness and acquisition, but it ignores everything that happened between discovery and purchase.
Last-click gives all credit to the final touchpoint before conversion. Still the default in many platforms. It systematically over-credits bottom-funnel channels (paid search, retargeting) and under-credits everything that built intent.
Multi-touch rule-based models
Data-driven and algorithmic attribution (MTA)
Data-driven models use machine learning to assign credit based on actual conversion patterns in your data. GA4’s data-driven attribution is the most accessible example. These models adapt to changing behavior and privacy signals, but they require sufficient conversion volume (GA4 recommends at least 400 conversions per month per channel) and human oversight to catch input quality issues.
Media Mix Modeling (MMM)
MMM is a top-down econometric approach that uses aggregate data (spend, impressions, sales, external variables like seasonality and pricing) to estimate channel contribution. It doesn’t require user-level data, which makes it privacy-safe and useful for offline channels. The trade-off: it operates at a weekly or monthly granularity, so it can’t tell you which creative or audience drove a specific conversion.
Incrementality and holdout experiments
Incrementality testing is the only method that measures causal impact rather than correlation. You withhold a channel or campaign from a randomized holdout group and measure the difference in outcomes. It’s the gold standard for validating any attribution model’s outputs. The limitation is practical: you need sufficient sample size, clean randomization, and a long enough test window to see meaningful signal.

The IAB Playbook recommends combining MTA for known users, incrementality testing for causal validation, and MMM for top-down confirmation and offline coverage. That three-layer stack is the current practitioner standard.
When to use each approach:
- Use rule-based MTA when conversion volume is low and you need a starting point
- Move to data-driven MTA when you have 400+ monthly conversions per channel and a clean identity layer
- Add MMM when you have significant offline spend or non-addressable channels you can’t track at the user level
- Run incrementality experiments to validate any model’s outputs before acting on them
What are the biggest challenges in cross-channel attribution?
Even a well-designed attribution system runs into structural limits. Knowing them in advance prevents misplaced confidence in model outputs.
Signal silos and double-counting. Each platform’s native reporting attributes conversions using its own logic, usually last-click within its own ecosystem. When you aggregate those reports, you’re counting the same conversion multiple times. A customer who saw a Meta ad, clicked a Google search ad, and converted gets counted as a conversion in both platforms. Channel-level ROAS figures are almost always inflated for this reason.
Cross-device and cross-platform identity gaps. A customer who researches on mobile and converts on desktop looks like two different users without identity stitching. The literature on omni-channel attribution models notes that current dynamic attribution approaches often lack the features needed to handle full cross-device complexity, particularly for anonymous users.
Non-addressable channels. Linear TV, some connected TV inventory, out-of-home, and radio don’t generate user-level signals. They show up in MMM as aggregate spend variables but disappear entirely from MTA models. If you’re running significant spend in these channels and relying only on MTA, you’re systematically under-crediting them.
Privacy regulations and identifier deprecation. GDPR and CCPA restrict the data you can collect and how long you can retain it. Third-party cookie deprecation in Chrome (now underway) removes a key cross-site tracking mechanism. The practical response: anchor your identity layer to first-party data (email, CRM IDs, loyalty program membership), invest in server-side tagging to reduce reliance on browser-based tracking, and treat probabilistic matching as a supplement rather than a foundation.
Step-by-step playbook: how to implement cross-channel attribution
The IAB’s implementation framework organizes the work into four core layers. Here’s how to execute each one.
1. Centralize data (weeks 1–6)
Goal: All channel signals flowing into one warehouse.
- Audit every active channel and identify its data export format and latency
- Select a warehouse (BigQuery, Snowflake, or Redshift) and configure ETL pipelines for each source
- Define a canonical event schema: event name, timestamp, user identifier, channel, campaign, creative, conversion value
- Set data retention policies that comply with GDPR/CCPA requirements
Owner: Data engineering, with marketing ops defining the schema requirements.
Checkpoint: Every channel has a live pipeline and data is landing in the warehouse within 24 hours of the event.
2. Enforce data quality and naming conventions (weeks 3–8, overlapping)
Goal: Clean, consistent, trustworthy data before any model runs.
- Publish a UTM taxonomy document and enforce it through campaign launch workflows
- Build automated data quality checks: missing UTMs, duplicate event IDs, timestamp anomalies
- Normalize channel names across sources (e.g., “Paid Social” not “paid_social”, “FB”, “Facebook Ads”)
- Document attribution windows for each channel and align them across the stack
Owner: Marketing ops and analytics.
Pro Tip: Run a UTM audit on your last 90 days of campaign data before building any model. You’ll almost always find at least three sources of inconsistency that would have silently corrupted your attribution outputs.
3. Identity resolution strategy (weeks 6–12)
Goal: Stitch user journeys across devices and sessions.
- Define your known-user population: logged-in users, email subscribers, CRM contacts
- Implement deterministic matching using hashed email as the primary key
- Layer probabilistic matching for anonymous users, with a documented confidence threshold
- Validate match rates: what percentage of conversions have a stitched journey?
Owner: Data engineering and CRM team.
4. Model selection and governance (weeks 10–16)
Goal: A running attribution model with documented assumptions and a review cadence.
- Select a primary model based on your conversion volume and journey complexity (see the decision guide below)
- Run rule-based and data-driven models in parallel for 4–6 weeks before switching
- Build a reporting dashboard that shows channel contribution, journey paths, and model confidence
- Establish a governance cadence: monthly model review, quarterly full audit
Owner: Analytics lead, with sign-off from marketing leadership.
Checkpoint: Model outputs are reviewed monthly and any anomalies trigger a documented investigation.
| Layer | Timeline | Primary owner | Key deliverable |
|---|---|---|---|
| Data centralization | Weeks 1–6 | Data engineering | All channels in warehouse, live pipelines |
| Data quality and UTMs | Weeks 3–8 | Marketing ops | UTM governance doc, quality dashboard |
| Identity resolution | Weeks 6–12 | Data engineering + CRM | Deterministic + probabilistic match pipeline |
| Model selection and governance | Weeks 10–16 | Analytics lead | Running model, monthly review cadence |
Which approach fits your business scenario?
| Scenario | Recommended primary approach | Rationale | Key caveat |
|---|---|---|---|
| Low-volume direct-response brand (<400 monthly conversions) | Rule-based MTA (position-based or time-decay) | Insufficient data for algorithmic models; rule-based gives a structured starting point | Validate with small holdout tests; don’t over-optimize on model outputs alone |
| High-volume ecommerce with logged-in users | Data-driven MTA + incrementality testing | Sufficient conversion volume; known-user share enables reliable identity stitching | Requires clean UTM discipline and a stable identity layer |
| Long B2B sales cycles (60–180 days) | MMM + CRM-based journey analysis | Long cycles make MTA windows unreliable; MMM captures aggregate contribution over time | MTA can supplement for digital-only touchpoints if journey is partially trackable |
| Offline/retail-heavy campaigns | MMM as primary, MTA for digital overlay | Offline channels are non-addressable; MMM handles aggregate spend variables | Requires clean sales data and external variable inputs (seasonality, pricing) |
How to validate your attribution: experiments and model benchmarking
Model outputs are hypotheses until you test them. Validation is not optional.
Designing incrementality tests
- Define the question. What channel or campaign are you testing? What conversion metric are you measuring?
- Size the holdout group. A minimum of 10% of your audience withheld from the channel being tested is a common starting point. For statistically meaningful results, calculate required sample size based on your baseline conversion rate and the minimum detectable effect you care about.
- Randomize cleanly. Use geographic holdouts (geo-based experiments) or user-level holdouts depending on your identity infrastructure. Geographic holdouts are easier to implement but introduce confounders (regional differences, local events).
- Set the test window. Run the test for at least one full purchase cycle. For ecommerce, two to four weeks is typical. For B2B, you may need a full quarter.
- Analyze and operationalize. Compare conversion rates between exposed and holdout groups. The difference is your incremental lift. Document the result, update your model assumptions, and schedule a retest in 90 days.
Benchmarking models
Run your rule-based model and your data-driven model simultaneously against the same dataset for 4–6 weeks. Compare their outputs against agreed KPIs: channel contribution percentages, predicted versus actual conversion rates, and budget recommendations. Where they diverge significantly, investigate the cause before acting on either.
GA4’s data-driven attribution documentation notes that even adaptive models need human oversight because outputs depend entirely on input quality. A model that looks confident can be confidently wrong if the underlying data has gaps.
Amazon Ads’ cross-channel research shows that display and video combinations can produce conversion lift well above what single-channel models predict. This is exactly the kind of finding that incrementality testing surfaces and rule-based models miss entirely.
When experiments aren’t feasible: If you lack the traffic volume for a clean holdout, use synthetic control methods (matching a test region to a statistically similar control region) or run a budget-pause test on a single channel for two weeks and measure the revenue impact. Neither is as clean as a randomized experiment, but both give you directional signal that’s better than model outputs alone.
The part most attribution guides skip
There’s a version of this conversation that stays entirely in the modeling layer, debating last-click versus data-driven attribution as if the choice of algorithm is the main event. It isn’t.
The teams that get attribution right spend most of their time on data architecture and governance, not model selection. A data-driven model running on inconsistent UTMs, fragmented identity, and siloed pipelines will produce confident-looking outputs that are fundamentally unreliable. A position-based rule-based model running on clean, centralized, well-governed data will outperform it in practical usefulness every time.
The second thing most guides understate is the organizational dimension. Attribution is not an analytics project; it’s a cross-functional operating change. Marketing ops needs to enforce UTM discipline. CRM needs to share identity data. Finance needs to accept that attribution-based budget recommendations will sometimes contradict channel-level ROAS. Without that alignment, even a technically excellent attribution system gets ignored or overridden.
The third point: incrementality testing is not a one-time validation exercise. It’s a recurring operational practice. Consumer behavior changes, channel algorithms change, privacy constraints change. A model calibrated on last year’s data is making assumptions that may no longer hold. Build the testing cadence into your quarterly planning cycle, not as a special project.
For teams evaluating how to resource this work, the Fractional CMO vs. Marketing Agency question is worth thinking through carefully. Attribution infrastructure requires both technical depth and strategic alignment, and the resourcing model shapes what’s actually achievable.
Gleanit connects your attribution data in one place
Most attribution failures aren’t model failures. They’re data visibility failures: signals scattered across platforms, no unified view of the customer journey, and no system flagging when something breaks. Gleanit addresses the practical layer that sits between raw channel data and model-ready inputs.
The platform monitors ads and customer journeys automatically across Meta, TikTok, Google, and LinkedIn, pulling signals into a connected view that maps directly to the four implementation layers above. Funnel gap diagnostics surface where journeys break down, and prioritized recommendations tell you which fixes will move the needle. AI-powered reporting means your attribution outputs reach stakeholders in a format they’ll actually use, not a data dump that requires a separate analyst to interpret.

If you’re building or rebuilding your attribution stack, start a trial at Gleanit to see how automated monitoring and unified journey tracking reduce the data-architecture work that blocks most teams from getting to the modeling stage.
Sources
- IAB Cross-Channel Measurement Best Practices + Playbook
- What is Cross-Channel Attribution? A Complete Guide | Amazon Ads
- What Is Cross-Channel Measurement? How It Works and Why It Matters - Dynata
This article provides general informational guidance on marketing measurement practices. Attribution strategies, data governance requirements, and regulatory compliance (including GDPR and CCPA) vary by organization, jurisdiction, and technology stack. Confirm current platform capabilities and legal requirements with qualified professionals before implementation.
Recommended
Corrections: ovannes@hearye.co or our editorial policy.