
Customer journey analytics (CJA) is the unified, time-ordered analysis of customer interactions across every channel that links observed behavior to measurable business outcomes. It answers the question your stakeholders actually care about: which paths lead to revenue, and which ones bleed it?
Three things it does for marketing teams right away:
- Find high-value conversion paths by tracing which sequences of touchpoints actually produce purchases, sign-ups, or renewals — not just which channels get last-click credit.
- Reduce stage drop-off by pinpointing exactly where customers stall or exit, so you fix the right friction instead of guessing.
- Validate interventions with outcome data by measuring whether a change to a message, flow, or channel actually moved a business metric, not just a vanity one.
If you run an agency or lead a measurement-first marketing team, this guide is written for you.
Key Takeaways
Customer journey analytics is a measurable performance discipline that links cross-channel behavior to business outcomes — and the teams that treat it that way consistently outperform those that treat it as a reporting exercise.
| Point | Details |
|---|---|
| CJA definition | Unified, time-ordered analysis of cross-channel interactions that links behavior to business outcomes. |
| Identity resolution is critical | Deterministic identity stitching is the foundation of accurate path analysis; session-based data fragments journeys. |
| Start with a pilot | Scope to one use case, one cohort, and one outcome metric before scaling to the full journey. |
| Measure business outcomes | Track stage conversion rates, CLV, and incremental revenue lift — not engagement vanity metrics. |
| Gleanit for agencies | Gleanit automates ad and journey monitoring, flags prioritized funnel gaps, and generates AI-powered client reports at scale. |
Table of Contents
- What does customer journey analytics actually cover?
- How does journey analytics differ from journey mapping?
- What business benefits can marketing teams expect?
- How do you run customer journey analytics step by step?
- What data do you need, and how do you connect it?
- Which metrics actually matter for journey analysis?
- What does a practical journey analytics stack look like?
- High-value use cases and a short case example
- What are the most common pitfalls, and how do you avoid them?
- Implementation checklist and sample timeline
- How do you measure ROI from journey improvements?
- How Gleanit helps marketing teams implement journey analytics
- What marketing leaders should know before starting CJA
- Gleanit makes journey analytics faster for agencies
- Sources
What does customer journey analytics actually cover?
According to Gartner, customer journey analytics and orchestration solutions combine cross-channel interaction data with transactional and voice-of-the-customer (VoC) data on a time axis to enable predictions at scale and verify the impact of multichannel interventions. That definition is worth unpacking because it draws the boundary clearly.
CJA covers behavioral events (clicks, page views, app sessions), transactions (purchases, renewals, returns), VoC signals (survey responses, CSAT scores, NPS), support interactions (chat transcripts, call logs, ticket resolutions), and offline touchpoints (in-store POS, field sales calls). The time axis is what makes it different from a dashboard: every event is stamped and sequenced so you can see the order in which things happen, not just the aggregate totals.
The cross-channel stitching idea is equally important. A customer who sees a Meta ad on Monday, reads a comparison page on Wednesday, and calls your support line on Friday is one person making one decision. CJA treats those three events as a connected sequence. Most analytics setups treat them as three separate sessions belonging to three separate users.
What CJA is not: it is not a one-off UX workshop, a static persona document, or a qualitative empathy map. Those are valuable, but they do not measure performance. CJA is a repeatable measurement discipline, not a design artifact.
Pro Tip: Start with a single high-value use case rather than trying to instrument every channel at once. A focused pilot on, say, trial-to-paid conversion gives you a clean hypothesis, a defined cohort, and a measurable outcome — and it builds internal credibility faster than a sprawling multi-channel project.
How does journey analytics differ from journey mapping?
The short answer: mapping is a design and hypothesis tool; analytics is how you verify whether the hypothesis was right.
Journey mapping produces a visual artifact — a swim-lane diagram or service blueprint that captures assumed customer emotions, touchpoints, and pain points. It is built from qualitative research: interviews, observation, workshops. It is invaluable for building empathy and generating hypotheses about where friction lives. But it does not tell you how many customers actually take that path, how long they spend at each stage, or whether fixing a specific touchpoint moved revenue.
Customer journey analytics measures what mapping can only visualize: it combines behavioral, transactional, and feedback data to quantify journeys and track performance over time.
| Dimension | Journey Mapping | Journey Analytics |
|---|---|---|
| Primary purpose | Design and empathy | Measurement and verification |
| Core inputs | Interviews, observation, workshops | Event data, CRM, transactions, VoC |
| Update cadence | Quarterly or project-based | Continuous or near real-time |
| Typical outputs | Visual map, personas, hypotheses | Path reports, funnel metrics, experiment results |
Example: A mapping workshop surfaces a hypothesis that customers drop off because the pricing page is confusing. Journey analytics then measures the actual exit rate on that page, segments by cohort, and after a redesign, quantifies whether the drop-off rate fell and whether downstream conversion improved. The map pointed at the problem; the analytics confirmed the fix worked.
Use both. The map tells you where to look; the data tells you whether you solved it.
What business benefits can marketing teams expect?
The clearest wins from CJA are operational: you stop spending budget on interventions that feel right and start spending it on ones that demonstrably work.
- Identify high-value conversion paths. Unifying cross-channel data into a single continuous view lets teams find which touchpoint sequences actually move customers toward outcomes — and which ones are just noise that inflates attribution models.
- Reduce churn and improve retention. When you can see the behavioral signals that precede cancellation (declining login frequency, skipped renewal reminders, unresolved support tickets), you can intervene before the customer is already gone.
- Increase customer lifetime value (CLV). Path analysis reveals which post-purchase sequences correlate with repeat buying, upsell acceptance, or referral behavior. Optimizing those paths compounds over time.
- Optimize channel spend. Last-click attribution systematically overvalues the final touchpoint and undervalues the ones that built intent. Journey-level analysis redistributes credit more accurately, so budget decisions reflect actual influence.
- Personalize at scale. When you know which stage a customer is in and what their prior behavior looks like, you can trigger the right message at the right moment rather than blasting the same campaign to everyone.
Secondary benefits are real too. Shared journey data creates a common evidence base across marketing, product, and customer success teams, which shortens the argument cycle when priorities conflict. And when you can show a stakeholder a funnel with stage-level conversion rates and a clear before/after from an experiment, the revenue storytelling gets a lot easier.
How do you run customer journey analytics step by step?
The workflow below follows the practical sequence that fusepoint recommends for customer journey analysis: define stages, identify touchpoints, measure stage-level performance, segment by customer type, diagnose friction, and prioritize fixes for economic impact.
Core steps:
- Define the business outcome. Name the metric you want to move: trial-to-paid conversion rate, 90-day retention, average order value. Everything else flows from this.
- Select the cohort. Choose a specific customer segment or time window. Mixing all customers obscures the patterns that matter for any one group.
- Map the stages and events. List the stages in the journey (awareness, consideration, trial, activation, retention) and the specific behavioral events that mark entry and exit from each stage.
- Unify identities. Connect events from different channels and devices to a single person profile. Without this step, your path analysis is fragmented and your conversion rates are wrong.
- Run path analysis. Identify the most common routes customers take, the sequences that correlate with conversion, and the stages with the highest drop-off.
- Design and run an intervention. Change one thing: a message, a flow, a channel sequence. Keep it narrow enough to measure cleanly.
- Measure the outcome. Compare the intervention cohort against a holdout. Track the business metric you defined in step 1, not just the click rate on the thing you changed.
- Iterate. Document what worked, update the journey map, and move to the next highest-impact stage.
Example metric to track per step:
- Step 1: Baseline conversion rate for the target outcome
- Step 3: Event coverage rate (% of expected events actually firing)
- Step 4: Identity match rate (% of sessions linked to a known user)
- Step 5: Stage-level conversion rate and time-to-next-step
- Step 7: Incremental conversion lift vs. holdout group
Implementation checklist (copy into your project plan):
- [ ] Business outcome and success metric defined and agreed
- [ ] Target cohort scoped (segment, date range, channel)
- [ ] Journey stages and key events documented
- [ ] Data sources inventoried and access confirmed
- [ ] Identity resolution approach selected
- [ ] Baseline metrics captured before any changes
- [ ] Intervention designed with a single variable
- [ ] Holdout or control group established
- [ ] Measurement window set and agreed with stakeholders
- [ ] Results documented in an experiment registry
Pro Tip: For your first pilot, pick one hypothesis and resist the urge to test three things at once. A clean single-variable experiment gives you a result you can defend to leadership and a template you can repeat.
What data do you need, and how do you connect it?
Most organizations collect data across many channels but few connect the dots. Journey analytics creates a unified view to show customer paths, drop-offs, and which interactions actually influence outcomes. The data problem is usually not a shortage of data; it is fragmentation.
Typical data sources for a complete journey view:
- Web and app behavioral events (page views, clicks, session depth, feature usage)
- CRM records (lead status, account history, sales interactions)
- Order and transaction systems (purchase history, cart abandonment, returns)
- Support transcripts (chat logs, call recordings, ticket categories and resolutions)
- Survey and VoC data (CSAT, NPS, CES responses tied to specific interactions)
- Offline touchpoints (POS transactions, field sales notes, in-store events)
Identity resolution: the step most teams skip
Connecting those sources to a single person profile is where most implementations either succeed or quietly fail. Deterministic identity stitching uses a known identifier — an email address, a logged-in user ID, a loyalty number — to link events across sessions and devices. It is accurate but requires the customer to be authenticated at some point in the journey.
Probabilistic matching uses statistical signals (device fingerprints, IP patterns, behavioral similarity) to infer that two anonymous sessions belong to the same person. It extends coverage but introduces error. For enterprise-grade analysis, deterministic identifiers are the foundation; probabilistic matching fills gaps at the edges.
Identity stitching — connecting cross-channel and cross-device interactions to a single person profile rather than session- or cookie-based identifiers — is a key differentiator for enterprise-grade analytics. Session-based approaches fragment behavior and reduce the validity of path and attribution analysis. The investment in a proper identity layer pays back every time you run a path report or attribution model. (Gartner)
Integration patterns
Three common architectures handle the data plumbing differently:
Event-first pipeline: A tag manager or SDK fires structured events into a stream (Segment, Rudderstack, or a custom Kafka topic), which feeds a data warehouse. Analysis happens in the warehouse or a BI layer on top. Fast to instrument, flexible, but requires engineering support for identity stitching.
CDP-first stack: A customer data platform (CDP) handles ingestion, identity resolution, and audience activation in one layer. Lower engineering overhead for marketers, but CDPs add cost and can create a second source of truth if the warehouse already exists.
Warehouse-first stack: All data lands in a cloud warehouse (Snowflake, BigQuery, Databricks), identity stitching runs as a dbt model or a dedicated identity graph tool, and analysis runs in a BI tool or notebook. Most flexible for complex analysis; slower to activate for real-time use cases.
Privacy and compliance: US marketing teams operating under CCPA/CPRA must honor opt-out signals, provide data deletion on request, and limit the use of sensitive personal information. Practically, this means: collect only the events you need, hash or pseudonymize identifiers before they reach the analysis layer, document your data lineage, and build deletion workflows before you need them. Consent management platforms (CMPs) should gate event collection, not just cookie banners.
Which metrics actually matter for journey analysis?
The metrics that matter are the ones tied to stage transitions and business outcomes — not engagement vanity metrics. A customer journey analysis should measure the economics of each stage: conversion rates by stage, time between interactions, and revenue per transition, so improvements translate into profitable growth.

| Metric | Definition | Why it matters for journey analysis |
|---|---|---|
| Stage conversion rate | % of customers who advance from one stage to the next | Identifies which stage is the biggest constraint on growth |
| Time to progress | Median time between stage entry and advancement | Reveals friction and velocity; long gaps often signal unresolved objections |
| Drop-off rate | % of customers who exit the journey at a given stage | Quantifies the cost of friction at each touchpoint |
| Customer lifetime value (CLV) | Projected revenue from a customer over their relationship | Ties journey optimization to long-term revenue, not just immediate conversion |
| CSAT / NPS / CES | Customer satisfaction, net promoter, and effort scores | Links experience quality to behavioral outcomes; CES is especially predictive of churn |
| Containment rate | % of support interactions resolved without escalation | Measures self-service effectiveness; a proxy for journey friction in post-purchase stages |
| Churn rate | % of customers who cancel or lapse in a period | The lagging indicator that journey improvements should move |
| Revenue per transition | Average revenue associated with a specific stage advancement | Prioritizes which stage improvements have the highest economic payoff |
Genesys notes that standard KPIs in journey analytics include CSAT, NPS, CES, conversion rates at each step, CLV, containment, and churn — and these should be aligned to stages for measurable improvement. The key word is aligned: a CSAT score floating in a dashboard with no stage context tells you almost nothing actionable.
Dashboard structure that works: one tile per stage showing conversion rate and drop-off, a trend line for CLV by cohort, a CSAT/CES heatmap by touchpoint, and a single experiment tracker showing active tests and their current lift estimates.
What does a practical journey analytics stack look like?
The architecture has five layers. You do not need all five on day one, but you need to know where each one lives before you start buying tools.
- Ingestion layer: Collects and structures raw events from web, app, CRM, and offline sources. Options range from tag managers and SDKs to API connectors and batch file imports.
- Identity layer: Stitches events to person profiles using deterministic and probabilistic matching. This can live inside a CDP, a warehouse dbt model, or a dedicated identity graph service.
- Storage layer: A cloud data warehouse (Snowflake, BigQuery, Databricks) or a CDP that doubles as a profile store. Warehouse-first gives you more analytical flexibility; CDP-first gives you faster activation.
- Analysis and AI layer: Path analysis, funnel visualization, cohort analysis, and predictive modeling. This can be a BI tool (Looker, Tableau), a purpose-built journey analytics product, or a notebook environment (Python/SQL).
- Orchestration and activation layer: Triggers interventions based on journey stage or predicted behavior. Email platforms, paid media APIs, CRM workflows, and real-time messaging tools all live here.
Three stack patterns for agencies
Quick pilot (4–6 weeks, minimal engineering): Use existing tag manager events, export to a spreadsheet or lightweight BI tool, and manually stitch identities using email as the key. Scope to one funnel stage. Good for proving the concept to a client before investing in infrastructure.
Scalable enterprise client: Event pipeline into a cloud warehouse, dbt models for identity stitching and stage logic, a BI tool for visualization, and a CDP or marketing automation platform for activation. Takes 8–16 weeks to instrument properly but scales to millions of events.
Fully managed retainer work: A platform that automates data capture, journey gap detection, and prioritized recommendations across multiple client accounts, with AI-assisted reporting. This is where tools like Gleanit fit: automated monitoring across Meta, TikTok, and Google, funnel gap diagnostics, and AI-generated reports that agencies can deliver to clients without rebuilding the stack for every engagement.
High-value use cases and a short case example
The use cases that consistently deliver the clearest ROI share one trait: they connect a specific behavioral signal to a specific business outcome, with a clean before/after measurement.
- Conversion path discovery: Find which multi-touch sequences produce the highest-value customers, then shift budget toward the channels that appear early in those sequences.
- Onboarding optimization: Identify the activation events that predict long-term retention (the “aha moment”), then redesign the onboarding flow to get more users there faster.
- Churn prediction and rescue: Detect the behavioral patterns that precede cancellation (reduced feature usage, skipped check-ins, unresolved tickets) and trigger a targeted intervention before the customer churns.
- Channel spend reallocation: Replace last-click attribution with journey-level path analysis to identify which channels build intent versus which ones just capture it, then reallocate budget accordingly.
- Contact center containment: Map the journeys that end in a support call and identify which self-service touchpoints could have resolved the issue earlier, reducing cost per contact.
Short case example: A SaaS company noticed a high drop-off between free trial sign-up and first meaningful feature use. Journey analysis showed that users who completed a specific setup step within 48 hours of sign-up converted to paid at three times the rate of those who skipped it. The team redesigned the onboarding email sequence to surface that step earlier and added an in-app prompt. Paid conversion from trial improved measurably within 60 days, and the change was validated against a holdout group.
Prioritization framework: Score each use case on expected economic impact (how much revenue or cost is at stake), ease of implementation (data availability, engineering effort), and data quality (how clean and complete the relevant events are). Start with high-impact, high-data-quality use cases even if they require moderate engineering effort. Low-data-quality use cases waste time regardless of their theoretical value.
What are the most common pitfalls, and how do you avoid them?
Every CJA project runs into the same set of problems. Knowing them in advance cuts the failure rate significantly.
- Data silos: Marketing, product, and support each own a piece of the journey and none of them shares it automatically. Mitigation: establish data contracts between teams before instrumentation begins, with agreed event schemas and ownership.
- Poor identity resolution: Fragmented session data produces path reports that look clean but are statistically wrong. Mitigation: audit your identity match rate before drawing conclusions; a match rate below 60% makes path analysis unreliable.
- Overfitting to noisy signals: Small cohorts and short time windows produce patterns that do not replicate. Mitigation: set minimum cohort sizes before analysis, and validate findings on a holdout period before acting.
- Governance gaps: No one owns the journey metrics, so they drift and become inconsistent across reports. Mitigation: assign a single owner for each journey metric and document definitions in a shared data dictionary.
- Misaligned incentives: Marketing optimizes for acquisition, product optimizes for activation, and customer success optimizes for retention — and none of them is accountable for the full journey. Mitigation: a cross-functional steering committee with a shared journey scorecard and explicit decision rights over interventions.
A short governance tip: the most durable CJA programs have one named person who owns the journey metrics, a monthly review cadence, and a written experiment registry. Without those three things, the program tends to produce interesting analyses that nobody acts on.
Implementation checklist and sample timeline
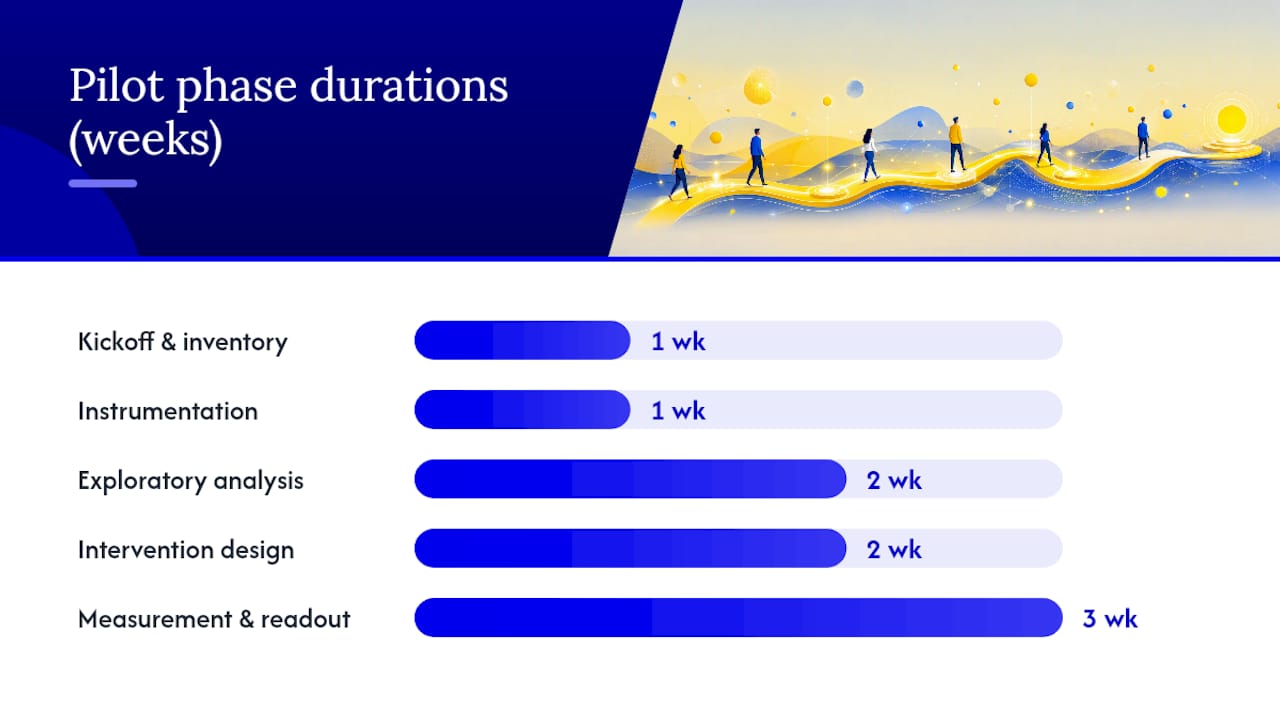
A minimum viable CJA pilot can run in 6–10 weeks if scoped tightly. The recommended approach is a narrowly scoped pilot that proves impact before scaling, prioritized by expected economic impact and data availability.
Numbered implementation checklist:
- Weeks 1–2 (Kickoff and inventory): Define the business outcome, select the pilot use case, inventory existing data sources, confirm access and ownership, document the target journey stages and events.
- Weeks 2–3 (Instrumentation): Instrument missing events, validate event firing against the schema, confirm identity resolution approach and measure baseline match rate.
- Weeks 3–5 (Exploratory analysis): Run path analysis on the baseline cohort, identify the highest-impact drop-off stage, document the hypothesis for intervention.
- Weeks 5–7 (Intervention design): Design the intervention (message change, flow redesign, channel addition), set up the holdout group, confirm measurement window.
- Weeks 7–10 (Measurement and readout): Measure outcome against holdout, document results in the experiment registry, present findings to stakeholders, decide whether to scale or iterate.
Decision gates: At the end of week 3, confirm the data quality is sufficient to proceed (identity match rate, event coverage). At the end of week 7, confirm the intervention is running cleanly before committing to the measurement window.
Team roles:
- Marketing analyst: owns the hypothesis, defines KPIs, runs path analysis, writes the readout.
- Product or engineering: instruments events, builds identity stitching, maintains the data pipeline.
- Marketing or CX manager: owns the intervention design and activation (email, in-app, paid).
- Data or analytics engineer: builds and maintains the warehouse models and identity layer.
- Leadership sponsor: removes blockers, approves budget for tooling, holds teams accountable to the shared scorecard.
The minimum viable pilot needs: one defined outcome metric, one cohort, one intervention, one holdout group, and one named owner. That is it. Scale comes after proof.
How do you measure ROI from journey improvements?
Tying journey work to business outcomes is what separates a CJA program that gets renewed from one that gets cut. Treating customer journey analysis as a measurement discipline — with experiments, an experiment registry, and causal links to outcomes — is what makes the ROI case defensible.
Measurement methods:
- A/B tests and holdouts: The cleanest method. Randomly assign customers to intervention and control groups, measure the outcome metric for both, and calculate lift. Works well for email, in-app, and paid interventions.
- Pre/post cohort analysis: Compare the same cohort before and after a change. Less rigorous than a holdout but practical when randomization is not possible (e.g., a site-wide redesign).
- Lift experiments: Measure incremental impact by comparing exposed versus unexposed groups, controlling for selection bias where possible.
- Attribution reconciliation with MMM: Where marketing mix modeling is available, reconcile journey-level attribution findings with MMM outputs to cross-validate channel contribution estimates.
Simple ROI formula:
ROI = (Incremental revenue from journey improvement) / (Project cost) × 100
Incremental revenue is the difference in conversion rate or CLV between the intervention cohort and the holdout, multiplied by the number of customers in the cohort and the average revenue per conversion. Project cost includes analyst time, engineering time, and any tooling costs specific to the pilot.
Governance checklist for sustained CJA practice:
- [ ] Named owner for each journey metric
- [ ] Monthly review cadence with a fixed agenda
- [ ] Experiment registry updated after every test
- [ ] Quarterly readout to leadership with business-outcome framing
- [ ] Annual audit of event schema and identity match rate
How Gleanit helps marketing teams implement journey analytics
For agencies running CJA across multiple client accounts, the operational overhead is the real constraint. Instrumenting a new stack for every client, maintaining event schemas, and producing readable reports on a retainer cadence is where most agency CJA programs stall.
Gleanit automates the monitoring layer: it tracks ads and customer journeys across Meta, TikTok, and Google, identifies funnel gaps, and surfaces prioritized recommendations so analysts spend time on decisions rather than data wrangling. The platform maps directly onto the workflow steps covered earlier:
- Data capture: Automated monitoring of ad performance and on-site journey events across platforms, with a Chrome extension for fast capture and a swipe file for creative research.
- Journey stitching and gap detection: Funnel gap diagnostics that flag where customers drop off and which fixes have the highest expected ROI, so agencies can prioritize client recommendations with evidence rather than intuition.
- Reporting and activation: AI-powered report generation that produces client-ready documents from journey data, with integrations into Slack, Discord, Telegram, WhatsApp, and Figma for team collaboration.
Benefit bullets for agencies using Gleanit:
- Faster audits: automated monitoring replaces manual data pulls across multiple ad platforms.
- Prioritized fixes: the platform ranks funnel gaps by expected impact, so the highest-ROI changes surface first.
- Repeatable reporting: AI-generated reports mean every client gets a consistent, professional readout without rebuilding the template each time.
- Client-dedicated workspaces: separate environments per client keep data clean and reporting organized at scale.
What marketing leaders should know before starting CJA
Start with one use case, lock an owner, and measure a business outcome — not a dashboard metric.
The most common failure mode is not a technology problem. Teams instrument everything, build a beautiful journey dashboard, and then discover that nobody is accountable for acting on what it shows. The dashboard becomes a reporting artifact instead of a decision tool.
Three pieces of advice worth acting on immediately:
- Pick one use case and go deep. A focused pilot on trial-to-paid conversion or 90-day retention will teach you more about your data quality, identity gaps, and team dynamics than a sprawling multi-channel project. It also gives you a result you can defend.
- Name an owner before you start. The journey metrics need a single person who is accountable for them — not a committee, not a shared responsibility. That person sets the cadence, runs the reviews, and escalates blockers.
- Measure business outcomes, not activity metrics. Conversion rate lift, incremental revenue, and churn reduction are what leadership cares about. Page views and session duration are not CJA outcomes; they are inputs.
The people and process side of CJA is harder than the technology. Leadership sponsorship matters because cross-functional work always hits a point where someone has to make a call about whose priorities win. Without a sponsor who can break that tie, the program stalls.
Gleanit makes journey analytics faster for agencies
Agencies that want to deliver journey analytics at scale without rebuilding a data stack for every client need a platform that handles the monitoring, gap detection, and reporting layers automatically. Gleanit does exactly that: it connects ad performance data from Meta, TikTok, and Google to downstream journey outcomes, flags the funnel gaps with the highest ROI potential, and generates client-ready reports with AI assistance — all in one connected view.
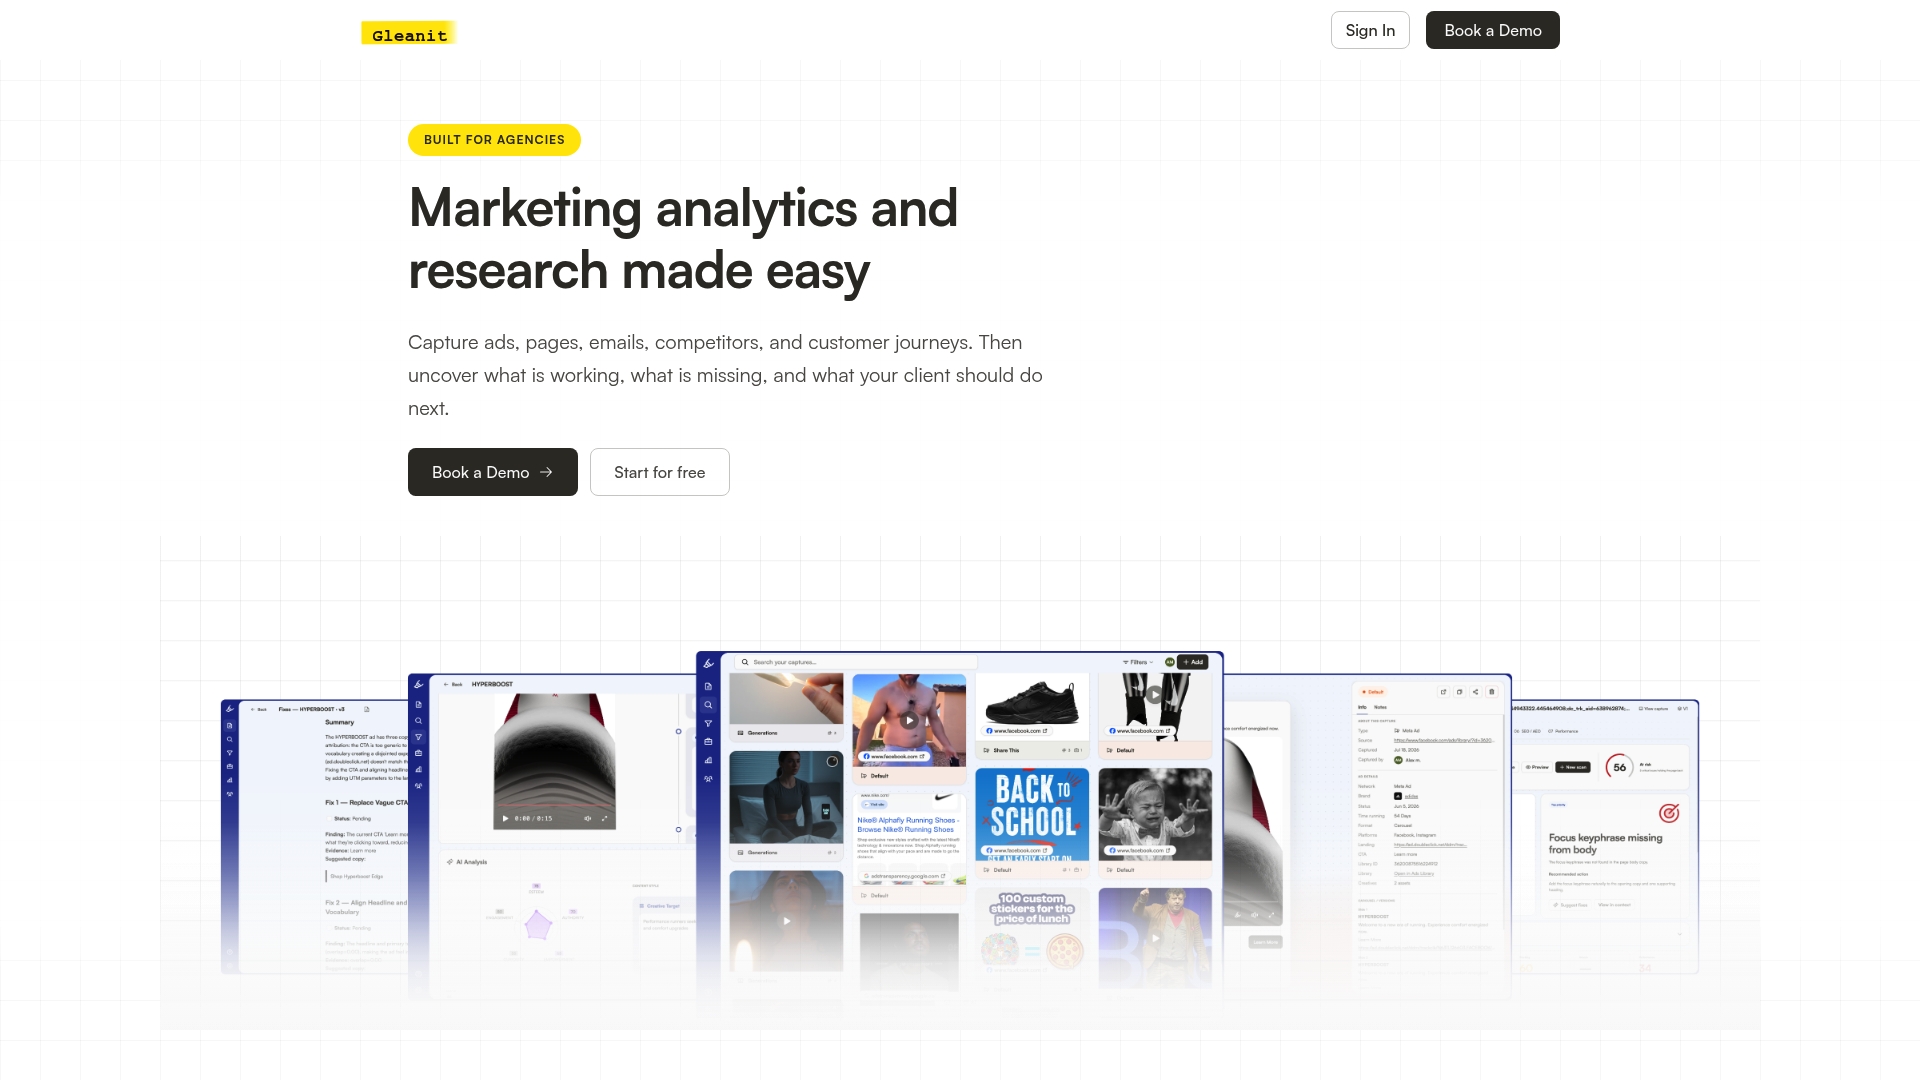
The platform is built for the retainer model: client-dedicated workspaces, weekly feature updates, and integrations with the collaboration tools agencies already use (Slack, Discord, Telegram, WhatsApp, Figma). You get a repeatable, scalable CJA workflow without the engineering overhead of a custom stack.
Start a free trial at Gleanit and run your first journey audit in days, not months.
Sources
The sources below back the claims in this guide and are worth reading directly for deeper technical or strategic context.
- Best Customer Journey Analytics & Orchestration Reviews 2026 | Gartner Peer Insights
- Customer Journey Analysis: How to Map & Optimize Growth | fusepoint
- Customer Journey Analytics — Fivetran
Recommended
Corrections: ovannes@hearye.co or our editorial policy.