
The all-industry Google Ads search medians for 2026 land at a click-through rate around 6.64%, a cost per click near $5.42, a conversion rate about 8.18%, and a cost per lead approximately $66.69, according to WordStream’s benchmark report covering more than 13,000 search campaigns from April 2025 through March 2026. Those four numbers are your starting point, not your finish line. This guide breaks them down by industry, campaign type, and device, then walks through exactly how to compare your account against them without fooling yourself.
Here’s the fast version of how to use this page: pull your account’s CTR, CPC, CVR, and CPL for the last 90 days, exclude brand terms, isolate Search campaigns from Display and Shopping, and match your row to the industry table below. If two or three of your numbers sit inside the 25th to 75th percentile range for your vertical, your account is performing normally. If they don’t, the gap tells you where to look first.
Before you dig into the tables, pull these from your Google Ads account:
- CTR, CPC, CVR, and CPL for the trailing 90 days, non-brand only
- A breakdown by campaign type (Search, Display, Shopping, Video, Performance Max)
- A device split (mobile vs. desktop vs. tablet)
- Your primary conversion action, isolated from micro-conversions
Key Takeaways
Cost per lead fell industry-wide in 2026 because conversion rates improved, not because clicks got cheaper, which means landing page work now outperforms bid adjustments for most accounts chasing efficiency.
| Point | Details |
|---|---|
| Headline 2026 medians | All-industry Search benchmarks: 6.64% CTR, $5.42 CPC, 8.18% CVR, $66.69 CPL. |
| Compare by industry, not blend | Match your vertical’s row; CPC alone ranges from about $1.63 to $9.87 across industries. |
| Segment before comparing | Split by campaign type, device, and brand versus non-brand before judging any metric. |
| CVR drives the 2026 trend | Conversion rate gains, not lower CPC, caused this year’s CPL decline in many industries. |
| Automate the tracking | Gleanit monitors ad and funnel data across platforms to catch conversion gaps benchmarks alone miss. |
Table of Contents
- Google Ads Benchmarks by Industry: CTR, CPC, CVR, CPL, and ROAS
- How Benchmarks Shift Across Campaign Type and Device
- What CTR, CPC, CVR, CPA, and ROAS Actually Tell You
- Comparing Your Account to Benchmarks: A Step-by-Step Method
- Where the Data Comes From and How to Judge Any Benchmark Set
- Why Cost Per Lead Dropped in 2026 (And What It Means for You)
- What to Prioritize First With These Benchmarks
- An Agency Perspective on Using Benchmarks Without Getting Fooled by Them
- Automate Your Benchmark Tracking With Gleanit
- Frequently Asked Questions
- Sources
Google Ads Benchmarks by Industry: CTR, CPC, CVR, CPL, and ROAS
Industry-level data is where most people actually need to look, because the all-industry median hides enormous variation. Web Tonic’s 2026 summary points out that CPC alone ranges from around $1.63 in Arts & Entertainment to nearly $9.87 for Attorneys and legal services. Comparing your law firm’s CPC to the $5.42 blended median tells you almost nothing useful.
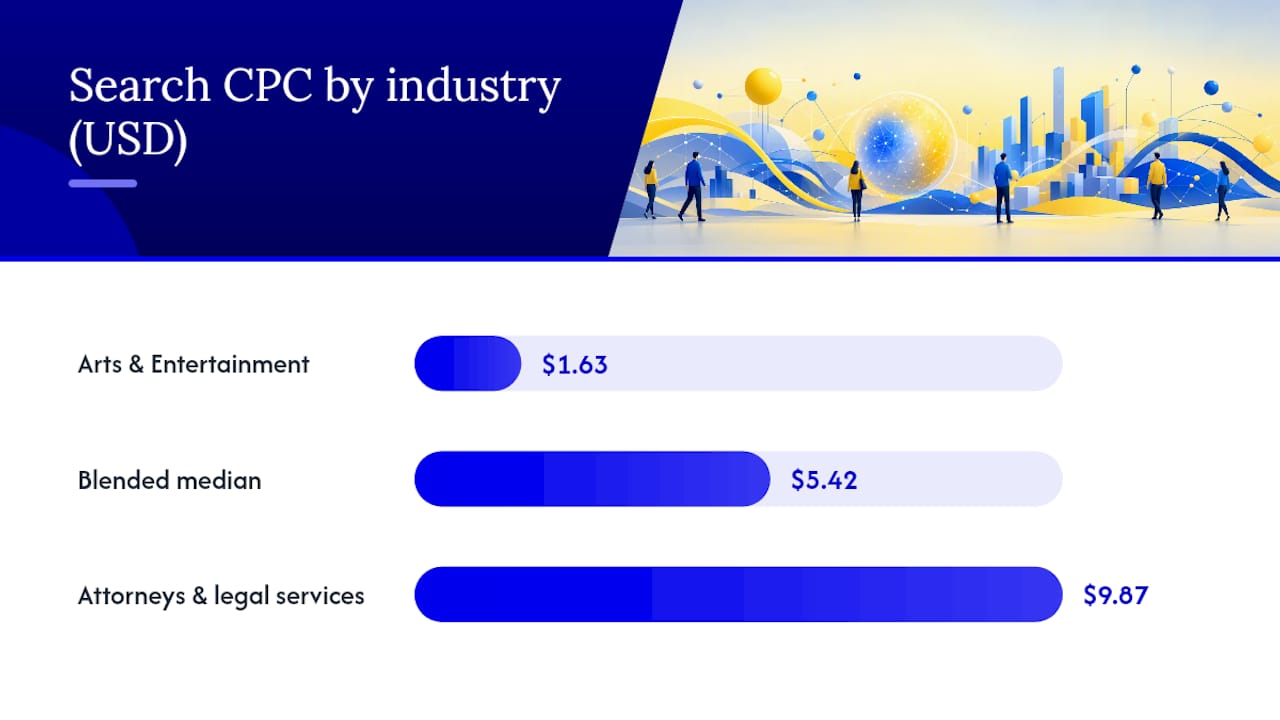
The table below shows median values with the interquartile range for each metric, drawn from search campaign data. Use medians as your baseline and ranges as your tolerance band, recognizing substantial variation by industry.
Interquartile spread matters more than the median alone. A legal services account with a CPC of $12 isn’t necessarily broken.
A few scope notes before you start comparing:
- These figures reflect Search campaigns only. Blending in Display or Shopping data will drag CTR and CVR in different directions and make the row useless for isolating Search performance.
- Figures are quoted in US dollars. If you’re running campaigns priced in another currency, convert or use a country-specific dataset like the one from XYZ Lab, which segments benchmarks by both country and industry.
- Match your row by what you sell, not by your company’s general category. A software company selling to consumers behaves more like e-commerce than like B2B/Technology.
- Never compare a Shopping campaign’s CVR against a Search benchmark row. Campaign type changes user intent enough to make the comparison meaningless, which is exactly what the next section covers.
How Benchmarks Shift Across Campaign Type and Device
Search, Display, Shopping, Video, and Performance Max campaigns don’t just have different average numbers. They measure fundamentally different kinds of user behavior, and treating them as interchangeable is the single most common benchmarking mistake agencies make.
Search campaigns capture people actively looking for a solution, so CTR and CVR both run high relative to other formats. Display campaigns interrupt people mid-task on other websites, so CTR drops sharply even when the targeting is excellent. Shopping campaigns show a product image and price before the click happens, which pre-qualifies traffic and tends to push CVR higher than standard Search. Video campaigns optimize for view rate or engagement more often than clicks, so comparing Video CTR to Search CTR is close to meaningless. Performance Max blends inventory across all of Google’s placements automatically, which makes it the hardest campaign type to benchmark cleanly, because Google’s own reporting mixes results across surfaces.
| Campaign Type | Typical CTR Pattern | Typical CPC Pattern | Typical CVR Pattern |
|---|---|---|---|
| Search | Highest of the group | Highest, driven by intent-based competition | Strong, especially non-brand |
| Shopping | Moderate | Lower than Search for retail | Often higher than Search due to price pre-qualification |
| Display | Lowest | Lowest per click | Lowest, best used for remarketing |
| Video | Low click-through, high view-through | Priced per view (CPV) more often than CPC | Rarely a primary conversion driver |
| Performance Max | Blended, hard to isolate | Blended | Can look strong but hides channel mix |
Device matters almost as much as campaign type. Mobile traffic typically shows a slightly higher CTR than desktop because ad placement takes up more of a small screen, but mobile CVR often lags desktop for anything with a longer purchase decision or a form-heavy checkout. Desktop tends to win on CVR for B2B lead generation and high-consideration purchases, while mobile wins on CTR for impulse or local intent searches.
A few rules to keep the comparison honest:
- Never benchmark a blended “All Campaigns” view against a single campaign type’s expected range. Split the report first.
- If your account runs Performance Max, pull the asset group and channel reports separately before comparing CVR, since Google’s summary view averages across placements you may not actually want.
- Compare mobile to mobile and desktop to desktop. A blended device average will mask a mobile landing page that’s quietly tanking your CVR.
What CTR, CPC, CVR, CPA, and ROAS Actually Tell You
Numbers without context are just noise, so here’s what each metric measures and what a deviation from benchmark usually means.
Click-through rate (CTR) is clicks divided by impressions. It tells you how relevant your ad copy and targeting are to the people seeing it. A CTR well below your industry median usually points to weak ad copy, a mismatched keyword-to-ad relationship, or an audience that’s too broad.
Cost per click (CPC) is your total spend divided by clicks. It reflects auction competition, Quality Score, and bid strategy. A CPC that’s running high against benchmark can mean you’re bidding aggressively in a competitive niche, or it can mean a low Quality Score is forcing you to pay more for the same position.
Conversion rate (CVR) is conversions divided by clicks. This is the metric most directly tied to your landing page and offer, not your ad. A CVR that lags benchmark almost always means the click delivered the wrong intent, or the page after the click failed to close the gap between promise and delivery.
Cost per lead or cost per acquisition (CPL/CPA) is spend divided by conversions, which is mathematically the same as CPC divided by CVR. This matters more than it sounds: you can lower your CPL either by cutting CPC or by raising CVR, and raising CVR is usually the cheaper lever to pull.
Return on ad spend (ROAS) is revenue divided by ad spend, typically expressed as a ratio or percentage.
CPM (cost per thousand impressions) and average order value (AOV) round out the set. CPM matters most for Display and Video, where you’re often paying for reach rather than direct response. AOV matters for e-commerce ROAS calculations, because a rising ROAS built on a shrinking AOV can hide a real problem with average basket size.
Pro Tip: When you’re reading any benchmark table, including this one, check whether it reports the median or the mean. A handful of huge-budget accounts can drag a mean CPC up by a wide margin, while the median tells you what a typical account actually pays. That’s why WordStream, Web Tonic, and most credible benchmark reports lead with median figures.
Comparing Your Account to Benchmarks: A Step-by-Step Method
Running a fair comparison takes more than glancing at your dashboard. Follow this sequence and you’ll avoid the most common false alarms.
- Set a 90-day window. Anything shorter gets noisy from day-to-day fluctuation; anything longer can blur a recent change in strategy or seasonality.
- Exclude brand campaigns. Brand search terms convert at rates that make every benchmark look easy to beat. Pull them out before you compare.
- Segment by campaign type. Run Search, Display, Shopping, Video, and Performance Max as separate reports, not a blended “All Campaigns” view.
- Split by device. Compare mobile against mobile benchmarks and desktop against desktop benchmarks, especially for CVR.
- Confirm your primary conversion action. If you’re tracking newsletter signups and purchases as equal conversions, your CVR and CPL numbers won’t mean anything against a benchmark built on a single defined action.
- Check your attribution window. A 7-day click window will show a lower CVR than a 30-day window for anything with a longer sales cycle, and that gap alone can make your account look worse than it is.
- Match your industry row precisely. Go by what you sell, not your company’s SIC code or general category label.
Once your numbers are cleaned up and segmented, watch for these red flags:
- CPC running well above your industry’s 75th percentile: check Quality Score first, then review whether your keyword match types are too broad and pulling in low-relevance auctions.
- CVR sitting below the 25th percentile: the problem is almost always downstream of the click. Audit landing page load speed, message match between ad and page, and form length.
- CTR below benchmark with CPC near or below benchmark: your bids are fine, but your ad copy or extensions probably need work.
- CPL far above benchmark despite CPC and CVR both looking normal: double-check your conversion tracking. Duplicate or misfiring conversion tags inflate CPL even when the underlying account is healthy.
Where the Data Comes From and How to Judge Any Benchmark Set
Not all benchmark reports are built the same way, and the gap between them is bigger than most people expect. WordStream’s 2026 report draws on more than 13,000 search campaigns tracked between April 2025 and March 2026 and reports median figures. PPC Chief’s dataset covers a similar period but reports averages instead of medians, landing on a $5.26 average CPC, 6.7% average CTR, 7.5% average CVR, and $70.11 average CPL, close to WordStream’s numbers but not identical. LocaliQ, published in partnership with WordStream, offers downloadable per-industry charts for readers who need the exact category breakdown rather than a summary table.
That gap between $66.69 and $70.11 for CPL isn’t an error. It’s a reminder that median and mean produce different answers, and that sample composition, which industries are weighted more heavily, which account sizes are included, shifts the headline number even when the underlying data pool overlaps significantly.
Before you trust any benchmark report, including this one, run it through a short checklist:
- Sample size and date range: A report built on a few hundred accounts over one quarter carries far less weight than one built on thousands of campaigns across a full year.
- Median vs. mean: Medians resist distortion from a handful of massive-budget outliers; means don’t. Web Tonic’s data on industry spread shows why this matters, since a small number of high-CPC verticals can pull a blended mean far from what a typical account experiences.
- Platform mix: Some benchmark sets blend Google and Microsoft Advertising data, which PPC Chief notes explicitly in its methodology. If you run Google-only campaigns, a blended dataset will show systematically different numbers than a Google-only report.
- Industry segmentation depth: A report with eight broad categories is less useful than one with thirty or more granular verticals, since “Professional Services” covers everything from accountants to architects.
That decade-long climb is the backdrop against which any single-year comparison should be read.
Why Cost Per Lead Dropped in 2026 (And What It Means for You)
The most notable shift in the 2026 data isn’t a new record high in CPC. It’s that median cost per lead actually fell, the first decline in five years, according to WordStream’s report. That’s worth sitting with for a second, because for half a decade the direction of travel had been almost entirely upward.
Since CPL is simply CPC divided by CVR, a falling CPL with a flat or rising CPC can only mean one thing: conversion rates got better. Clicks didn’t get cheaper. They got more productive.

What likely drove that shift? A few forces stand out. Automated bidding strategies, particularly Target CPA and Maximize Conversions, have had years to mature and now route budget toward higher-intent auctions more precisely than manual bidding ever could. Landing page tooling has also improved across the board, giving advertisers faster, more mobile-optimized experiences that hold onto clicks instead of losing them to a slow page load. Better audience signals, feeding first-party data into Google’s targeting systems, have likely tightened who actually sees the ad in the first place.
This matters most for accounts running Search and Shopping, where conversion happens close to the click. It matters less for Display and Video, where the funnel between impression and conversion is longer and noisier.
If you want to capture this trend rather than just read about it, a few moves make sense:
- Run a landing page experiment this quarter, even a simple one. A 90-day CVR improvement can lower your CPL faster than any bid adjustment.
- Re-check your attribution window. If you’re still using a 7-day click window while your buyer’s decision cycle runs longer, you may be under-crediting the conversion improvements already happening in your account.
- Audit your automation settings, since Target CPA and Maximize Conversions strategies need at least 30 to 50 conversions a month to optimize reliably. Fewer than that, and the algorithm is essentially guessing.
What to Prioritize First With These Benchmarks
Three moves matter more than the rest, and they’re worth doing in this order.
- Segment your account and compare it properly. Before you touch a single bid, split your data by campaign type, device, and brand versus non-brand, then match it to the correct industry row. Most “bad account” diagnoses turn out to be bad comparisons.
- Fix the landing experience before the bids. Given that CVR improvements are what’s driving the 2026 CPL decline industry-wide, a landing page fix will usually beat a bid adjustment for cost efficiency.
- Monitor your automation signals monthly, not quarterly. Automated bidding strategies drift as auction conditions shift. A monthly check catches a CPA creeping upward before it becomes a quarter’s worth of wasted spend.
Here’s the decision line that matters: if your CVR sits within the interquartile range for your industry but your CPL is still high, that’s a bidding or targeting problem, and iterative optimization will fix it. If your CVR sits well below the 25th percentile despite reasonable CPC and CTR, that’s usually a structural problem, a page, an offer, or a funnel mismatch, and no amount of bid tweaking will solve it. Structural problems need a rebuild, not an adjustment.
Ongoing monitoring is what turns a one-time benchmark check into a real advantage, since account performance shifts month to month and a static snapshot goes stale fast.
An Agency Perspective on Using Benchmarks Without Getting Fooled by Them
Benchmarks are most useful in client reporting when they’re used to ask better questions, not to hand out grades. A client account that beats the industry median CTR but lags on CVR isn’t succeeding. It’s masking a landing page problem behind an ad copy win, and if you report the CTR without the CVR context, you’re handing the client a false sense of security.

The pattern I’ve come to trust most in monthly reviews: when CPC sits right at benchmark and CVR sits well below it, the fix almost never lives in the ads themselves. In one case I reviewed, an account for a home services client had CTR and CPC both tracking close to the industry median, textbook healthy numbers by any surface-level read. But CVR was less than half the expected range for that vertical. The instinct on most teams would have been to test new ad copy or adjust bids. The actual fix was a broken mobile form that silently failed to submit on about a third of attempts. No amount of ad optimization would have touched that problem, because the problem wasn’t upstream of the click. It was downstream of it.
That’s the trap with benchmarks: they measure the parts of the funnel that are easiest to see, impressions, clicks, cost, while the thing actually breaking the account often sits one step further down, in a form, a page load, or a broken conversion tag. A tool that watches the whole customer journey, not just the ad metrics, catches that kind of gap faster than a spreadsheet full of monthly CTR numbers ever will. Treat these benchmark tables as a diagnostic starting point for the conversation with a client, not the conclusion of it.
Automate Your Benchmark Tracking With Gleanit
Manually pulling CTR, CPC, CVR, and CPL for every client account, segmenting by device and campaign type, and cross-checking against industry benchmarks every month eats hours that agencies rarely have to spare. Gleanit was built to close that gap by automating the monitoring work this guide just walked you through, so your team spends less time compiling numbers and more time acting on what they show.
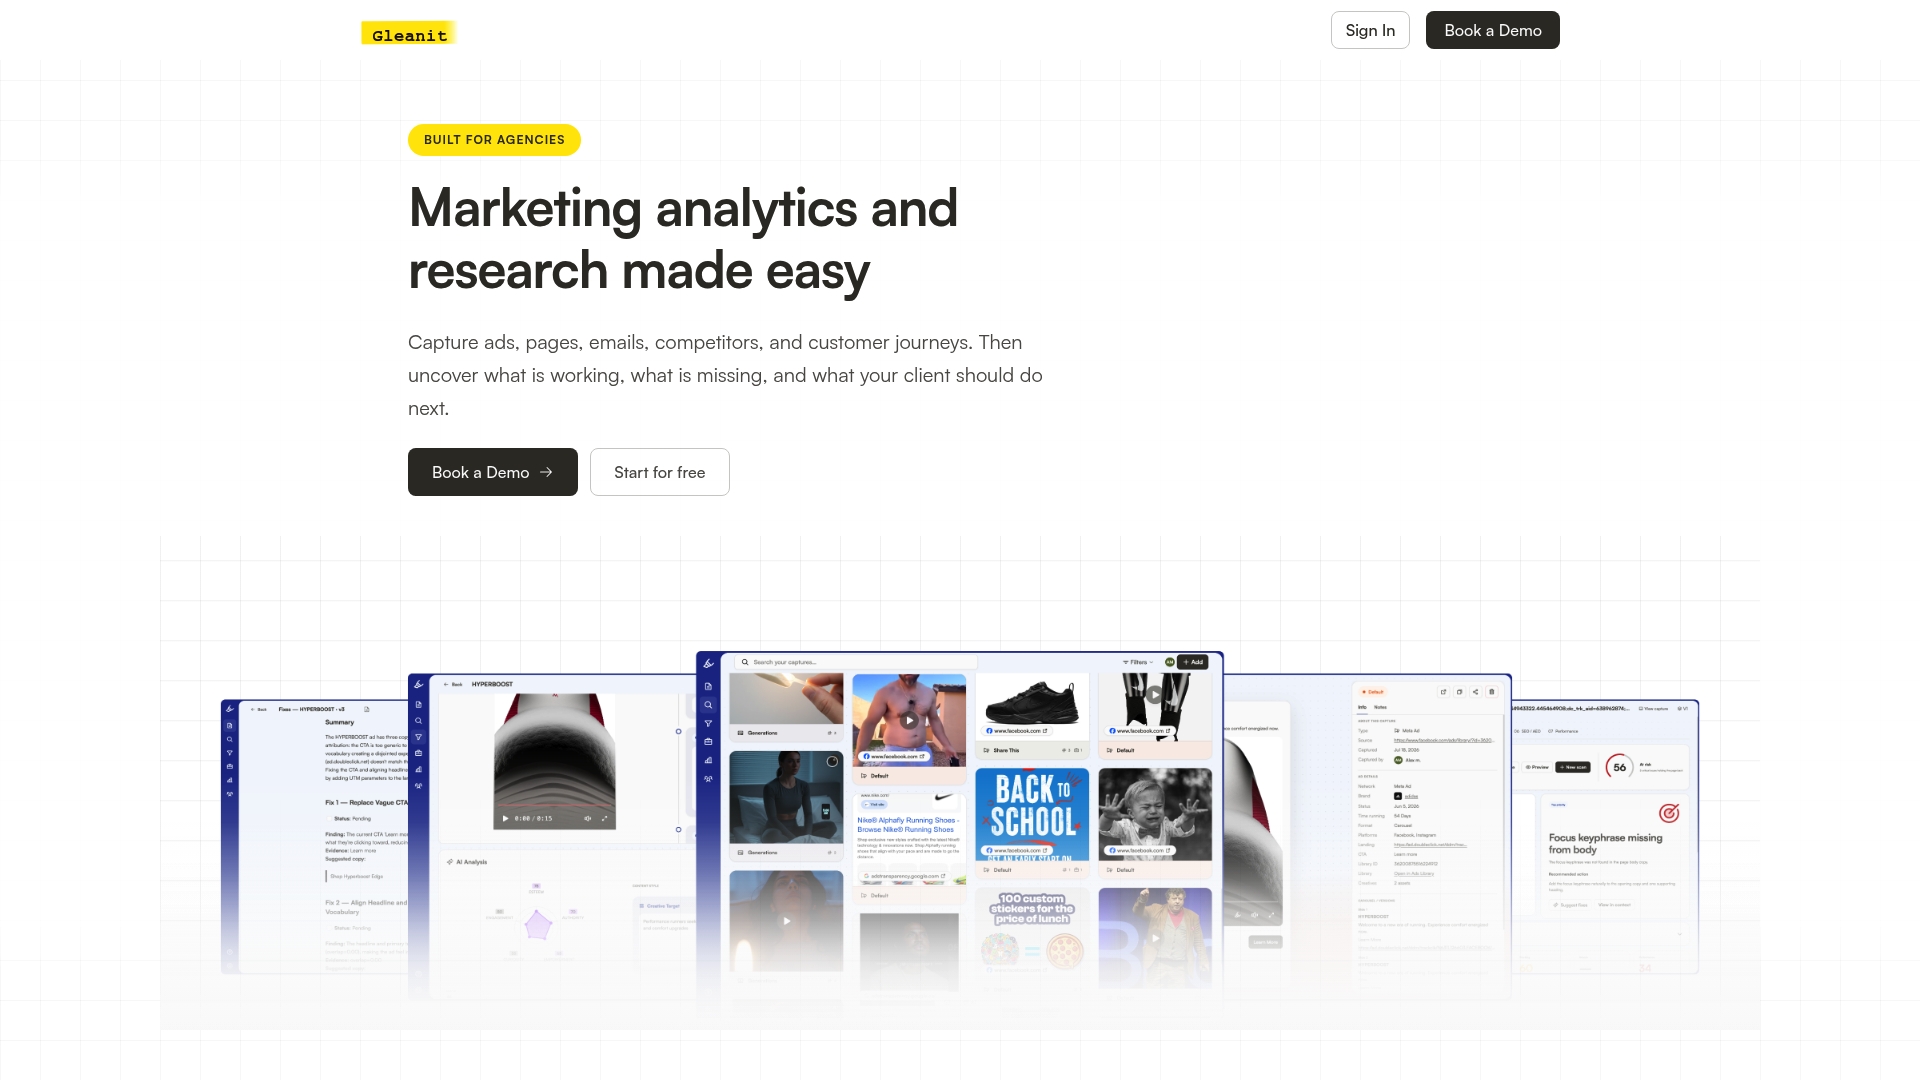
Gleanit tracks ads and customer journeys across Google, Meta, TikTok, and LinkedIn in one connected view, so you’re not stitching together exports from five different platforms to get a full-funnel picture. It flags funnel gaps automatically, the kind of broken form or mismatched landing page that benchmark tables alone can’t catch, and prioritizes fixes by likely ROI impact instead of leaving your team to guess where to start. Weekly feature updates mean the platform keeps pace with how paid search actually changes, and its AI-generated reports turn raw account data into client-ready summaries without a manual build every month.
If your agency reports on Google Ads performance for more than a couple of clients, start a Gleanit trial and run your next benchmark comparison through it instead of a spreadsheet.
Frequently Asked Questions
What is a good CTR for Google Ads in 2026?
What is the average CPC for Google Ads by industry? Average CPC varies enormously by vertical. Legal services often run close to $9 per click, while categories like arts and entertainment can sit under $2. The $5.42 all-industry median is a starting reference, not a target for every business.
Why did my CPL go up even though the industry average went down? CPL is CPC divided by CVR, so a rising CPL despite a falling industry median usually means your conversion rate dropped, your CPC rose faster than your conversions, or your tracking setup changed. Check your landing page performance and conversion tagging before assuming the ad account is at fault.
Should I use median or average benchmarks when comparing my account? Median benchmarks resist distortion from a small number of extremely high-spend or high-cost accounts, so they generally give a more realistic picture of what a typical account experiences. Averages can be useful for understanding total market spend patterns but tend to skew high in a right-tailed dataset like ad costs.
How often are Google Ads benchmarks updated? Most major benchmark reports, including WordStream’s, refresh annually, with some providers updating quarterly. Because auction dynamics and platform changes shift results throughout the year, treat any single benchmark snapshot as a directional guide rather than a fixed number.
Sources
The industry and headline figures in this guide draw from four 2026 benchmark reports, each built with a slightly different methodology worth understanding before you cite a number from any of them.
- Google Ads Benchmarks 2026: Competitive Data & Insights for Every Industry | WordStream
- Google Ads Benchmarks 2026: CPC, CTR, CVR, CPL | Web Tonic™
- 2026 Google Ads Benchmarks: $5.26 Avg CPC, 6.7% CTR - 28 | PPC Chief
- Search Advertising Benchmarks for Every Industry 2026 Data | LocaliQ
Most of these reports refresh annually, with WordStream’s series running as a consistent year-over-year benchmark since 2016. Check each publisher’s site directly for the latest dataset before quoting a figure in a client report, since benchmark numbers shift as new quarters of data roll in.
Recommended
Corrections: ovannes@hearye.co or our editorial policy.