
A marketing experiment backlog is a single prioritized queue of testable hypotheses, each tied to a business outcome, so nothing valuable dies in a spreadsheet tab nobody opens. The first move isn’t a fancy tool. Build one intake form, put a 30-minute grooming session on the calendar every week, and you’ll cut stale ideas and speed up how fast your team actually learns something.
TL;DR:
- Most backlog ideas stall due to excessive friction in submission and prioritization processes, not a lack of good hypotheses.
- Prioritize tests using impact and effort divided by estimated days to maximize value per hour, especially for high-impact, quick-win ideas.
- Weekly grooming, WIP limits, and tracking aging help keep the backlog healthy and prevent the accumulation of stale, untested ideas.
- Connecting hypothesis cards to specific business outcomes and strategic goals ensures testing remains aligned with company priorities.
- A single owner should oversee the backlog, with dedicated triage and experiment owners, to maintain clarity, focus, and steady progress.
Table of Contents
- What Fields Belong on Every Backlog Card?
- How Do You Prioritize a Marketing Test Queue?
- How Do You Keep the Backlog Moving Instead of Piling Up?
- What Should a Starter Backlog Template Include?
- Practical Fixes That Cut Backlog Aging Fast
- How Does the Backlog Connect to Your Broader Marketing Strategy?
- Who Owns the Backlog and Who Keeps It Clean?
- What Tools Actually Support This Workflow?
- How Do You Report Experiment Results to Leadership?
- How Do You Manage Dependencies Between Experiments?
- The Political Cost Nobody Puts on the Backlog Card
- Speed Up Your Backlog Triage With a Free Audit
- Sources
- FAQ
What Fields Belong on Every Backlog Card?
A card with too many required fields never gets filled out. A card with too few gets approved on gut feeling and wastes a testing cycle. The Reforge growth experiment management system settles this by keeping intake low friction while still forcing enough structure to move an idea forward, including a tracking metric, hypothesis, area of focus, expected impact, and confidence score.
Here’s the field set that holds up across channels, from paid social to email:
- Title: short and specific, not “improve onboarding” but “test 3-step vs 5-step signup flow”
- Business outcome or OKR link: which company goal this actually moves
- Hypothesis: a falsifiable claim with expected direction and threshold, like “shortening the form to 3 fields increases completion rate by at least 8%”
- Primary metric plus guardrail metrics: the number you’re chasing and the ones you’re watching so you don’t break something else
- Owner and date created: one name, not a team, so nothing sits ownerless
- Estimated effort: in days, rough is fine
- Area, channel, and tags: paid, lifecycle, SEO, whatever fits your stack
- Definition of done and a link to supporting data: what “finished” looks like before anyone starts building
The Pedowitz Group backlog playbook frames this as collect, clarify, score, prioritize, refine, measure, and the clarify step is exactly where most teams skip corners. Keep the initial required fields to five or six. You can always add detail once an idea gets picked, but a 20-field intake form guarantees people stop submitting ideas altogether.
How Do You Prioritize a Marketing Test Queue?
ICE (Impact, Confidence, Ease) and RICE (Reach, Impact, Confidence, Effort) are the two scoring models most growth teams reach for, and they solve slightly different problems. ICE is faster and works fine for a small team running a handful of tests a month. RICE adds a reach variable, which matters once you’re comparing a homepage test that touches every visitor against a niche email flow that touches 200 people a month.
A simple rubric: score Impact, Confidence, and Ease each from 1 to 10, multiply them, and rank the results.
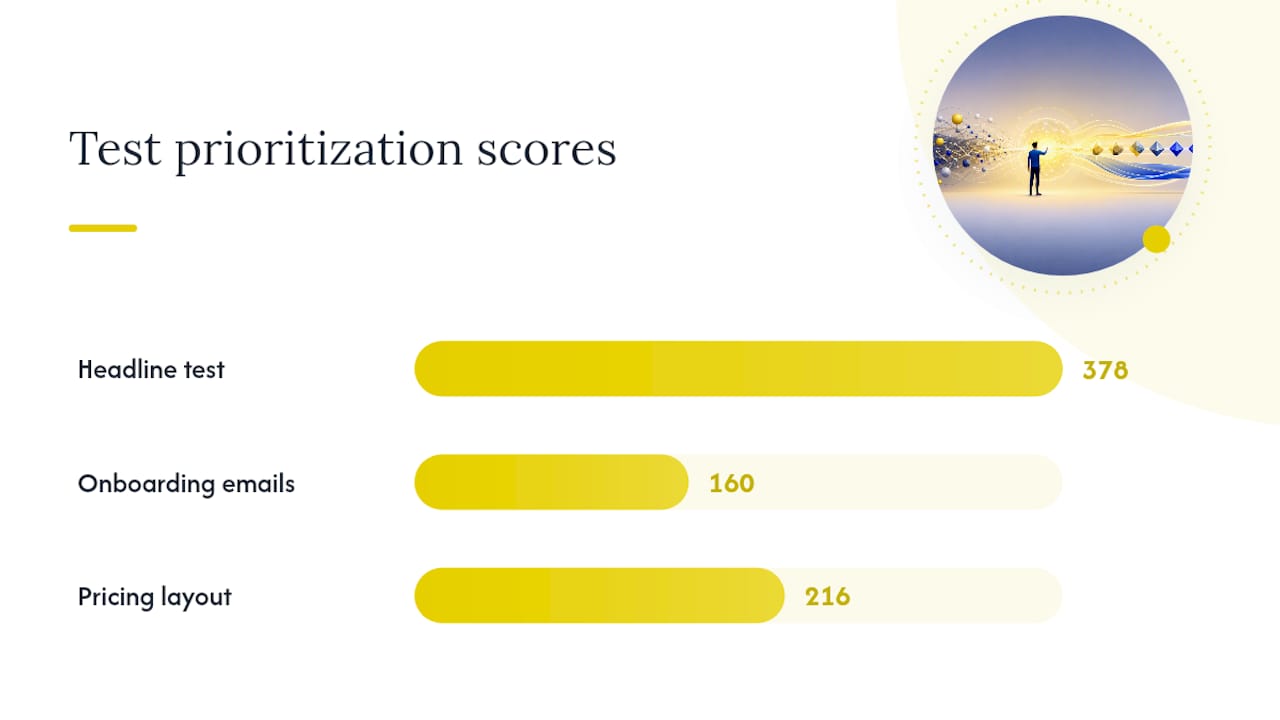
- Landing page headline test: Impact 7, Confidence 6, Ease 9 → score 378
- New onboarding email sequence: Impact 8, Confidence 5, Ease 4 → score 160
- Pricing page layout swap: Impact 9, Confidence 4, Ease 6 → score 216
The headline test wins on paper, but don’t stop at the raw score. Divide impact by estimated effort in days to see which test returns the most value per hour of work, because a high-impact idea that takes three weeks to build can still lose to a smaller one you ship this afternoon.
Sequencing matters more than most teams admit. The MarketingSherpa test-planning scenario tool shows how build time and analysis time change the financial return of a testing sequence, which is a useful way to make the case to a skeptical stakeholder who thinks prioritization is just opinion with a spreadsheet attached.
Pro Tip: Run your ICE or RICE score past a second person before it goes in the queue. A lone scorer almost always inflates confidence on their own idea.
How Do You Keep the Backlog Moving Instead of Piling Up?
A backlog without a lifecycle is just a graveyard with extra columns. Five states cover almost every team’s needs:
- Backlog: raw idea, minimum fields filled, not yet scored
- Queue: scored, prioritized, waiting for capacity
- In progress: actively built or running
- Analyze: data collection is done, someone’s reading results
- Archived: shipped, killed, or shelved with a documented reason
Weekly grooming is the habit that keeps this alive. Block 30 minutes, review the top five to ten items in the queue, re-score anything with new information, and archive anything untouched for 90 days. That single rule prevents the backlog from becoming a museum of good intentions.
WIP limits protect the data as much as the team’s sanity. Cap active experiments per campaign objective at one, and cap total in-progress experiments across the team at three or four. Run five landing page tests at once on the same traffic and you can’t tell which change moved the needle, a problem the HADI hypothesis board framework calls out directly when it recommends one active experiment per objective to avoid contaminating attribution.
Aging is the metric most teams never track and should. Spike AI’s backlog aging framework sorts items into four tiers: Fresh, Drifting, Stale, and Zombie, defined by increasing age thresholds. Adding up the estimated impact sitting in the older tiers reveals a substantial invisible cost called the Approval Cycle Tax, often larger than expected.
What Should a Starter Backlog Template Include?
You don’t need custom software to run a good marketing experiment backlog. A shared board with the right columns beats a polished tool with the wrong ones.
Your results-tracking fields should capture:
- Hypothesis and the metric it’s tied to
- Sample size and test duration
- Verdict: won, lost, or inconclusive
- The insight, written in plain language, not just a chart
- A follow-on idea, because a killed test almost always suggests the next one
The Notion growth experiment tracker template is a solid starting board. Copy it, strip out fields your channels don’t use, and add tags for whatever you’re actually running, whether that’s paid social creative tests or lifecycle email sequences.
Before you launch anything, run the sample-size math. If your baseline conversion rate is 4% and you want to detect a minimum detectable effect of 15%, low traffic pages can need several weeks to reach significance, not days. Skipping this step is how teams call a test “inconclusive” when it was actually just underpowered.
Every result, win or loss, belongs in a searchable insights library. Tag by channel and hypothesis type so six months from now, someone can search “email subject line” and find what already got tested instead of running it again.
Practical Fixes That Cut Backlog Aging Fast
Most backlog decay isn’t a strategy problem. It’s friction. A Slack channel with a dedicated hashtag, feeding straight into your intake form, captures ideas the moment someone has them instead of losing them in a meeting nobody wrote notes for. Assign one triage owner whose only job is making sure nothing sits unscored for more than a week.
Backlog health check: track backlog size, median age of open items, percentage of experiments shipped within 30 days of entering the queue, and overall experiment velocity. If median age keeps climbing while velocity flatlines, your approval process is the bottleneck, not your idea pipeline.
This is where a platform like Gleanit earns its place. It automates monitoring across Meta, TikTok, and Google and then surfaces the funnel gaps worth testing next, so your intake form fills with prioritized ideas instead of guesses.
How Does the Backlog Connect to Your Broader Marketing Strategy?
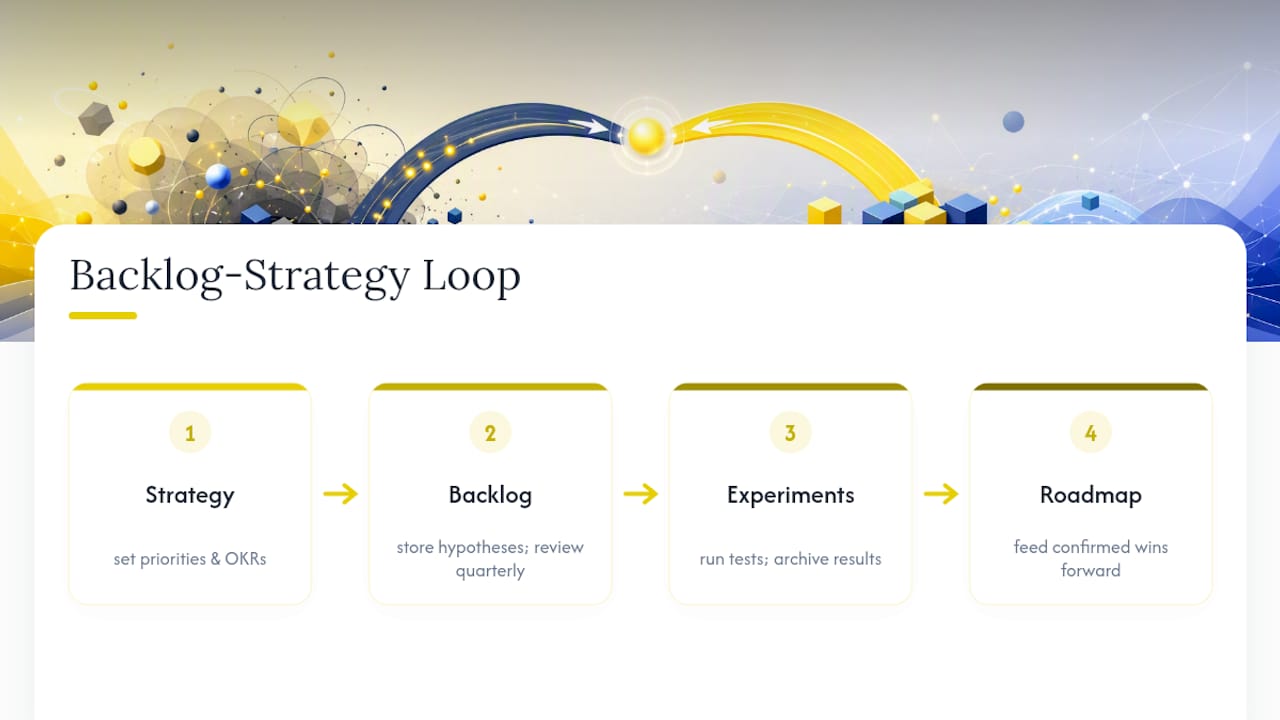
A backlog that runs disconnected from company goals turns into a list of interesting ideas nobody can defend in a budget meeting. Every card’s business outcome field should trace back to a quarterly OKR or a named revenue target, not a vague notion of “improving performance.”
This connection works in both directions. Strategy sets the direction, feeding the backlog fresh hypotheses tied to whatever the current priority is, whether that’s lowering customer acquisition cost or lifting retention in a specific segment. The backlog then feeds results back up. When three tests in a row confirm that a shorter checkout flow lifts conversion, that’s not just a win to archive. It’s a signal for the next quarter’s roadmap.
Review the top of the queue against strategic priorities during quarterly planning, not just weekly grooming. An idea that scored well on ICE six months ago might no longer matter if the company shifted focus from acquisition to retention. Kill it or re-score it, but don’t let it linger just because it once looked promising.
The tightest teams treat the backlog as a live input to strategy discussions, not a separate operational artifact that marketing runs on the side. When a VP asks why the roadmap includes a particular initiative, the answer should trace directly to a test result sitting in the Archived column.
Who Owns the Backlog and Who Keeps It Clean?
Someone has to own the backlog, and “the whole team” is not an answer that survives contact with a busy quarter. A single backlog owner, usually a growth lead or senior marketer, runs weekly grooming, enforces WIP limits, and has final say on what enters the queue.
A triage owner, who can be the same person on a small team, reviews new submissions within a few days and either scores them or sends them back for more detail. This role exists specifically to stop ideas from sitting in limbo with no hypothesis and no owner attached.
Individual experiment owners are different from the backlog owner. Whoever submits or claims a card is accountable for building the test, watching guardrail metrics while it runs, and writing the final insight when it wraps. Stakeholders, meaning anyone whose budget or team is affected by a test, get visibility into the queue but shouldn’t have unilateral power to jump their pet idea to the top. That’s what scoring is for.
Rotate the triage role every quarter on larger teams. It keeps one person from becoming an unintentional bottleneck and spreads the judgment calls across more of the team, which tends to produce better-calibrated confidence scores over time.
What Tools Actually Support This Workflow?
The backlog itself can live in Notion, a kanban board, or a spreadsheet. The tools that matter more are the ones feeding it and reporting out of it.
Collaboration platforms like Slack, Discord, or Telegram work well as intake capture points when connected to a form, turning a passing idea in a channel into a scored card without someone having to remember to write it down later. A unified marketing dashboard pulls performance data from multiple ad platforms into one view, which matters because half the job of prioritizing tests is knowing where the funnel is actually leaking.
For the tests themselves, an ad monitoring workflow that automatically flags underperforming creative saves you from manually pulling reports every Monday just to find the next test candidate. Whatever stack you land on, the key digital marketing metrics worth tracking should map directly to the guardrail metrics on your backlog cards, so a dashboard alert and a backlog re-score are looking at the same numbers.
How Do You Report Experiment Results to Leadership?
Leadership doesn’t want a spreadsheet dump of every test in flight. They want three things: what’s running, what shipped, and what it’s worth. A short weekly or biweekly update covering those three points, pulled straight from the Analyze and Archived columns, does more for stakeholder trust than a full backlog export ever will.
Frame results in business terms, not statistical ones. “The new checkout flow increased completion rate” lands better paired with the estimated revenue impact than with a confidence interval. Save the methodology detail for anyone who asks.
Wins and losses both deserve airtime. A killed test that saved the team from rolling out a change that would have hurt conversion is a genuine result, and reporting only wins trains stakeholders to expect a 100% success rate that no real testing program delivers. The MarketingSherpa sequencing tool is useful here too, since showing how sequencing and analysis time affect ROI helps a stakeholder understand why a test that “failed” still had value.
How Do You Manage Dependencies Between Experiments?
Two tests that touch the same page, audience, or metric at the same time will contaminate each other’s results, and this is the single most common way testing programs quietly poison their own data. Before greenlighting a card, check it against everything already in progress for overlapping traffic segments or shared pages.
Resource allocation follows the same logic as the WIP limits already on the board. If your design capacity can support two builds a month, don’t score five ideas into the queue as “approved” at once just because they all passed the ICE threshold. Rank by score, but gate entry into “In progress” by actual available capacity, not by how good an idea looks on paper.
Cross-channel dependencies deserve a tag of their own. An SEO content test and a paid search test targeting the same landing page need coordination, even if they’re owned by different people. A shared “depends on” field, even a simple text note, prevents one team from launching a test that undermines another team’s in-flight experiment.
The Political Cost Nobody Puts on the Backlog Card
The biggest threat to a marketing experiment backlog isn’t a bad hypothesis. It’s the Approval Cycle Tax, the slow bleed of value that happens while good ideas wait for sign-off. Leadership needs a KPI tied to velocity, not just win rate, or the incentive to keep testing quietly disappears.
Start smaller than you think you need to: one intake point, one 30-minute weekly grooming session, one WIP rule. Everything else in this article is worth building toward, but that trio is what actually gets a stalled backlog moving again.
— Ovannes
Speed Up Your Backlog Triage With a Free Audit
The workflow in this article works with nothing more than a shared doc and a calendar reminder. But if you’re staring at a backlog full of untested guesses about where your funnel is actually leaking, a quick diagnostic beats another round of debate about which idea to score first. Gleanit automates ad and customer journey monitoring across Meta, TikTok, and Google, then flags the funnel gaps most worth turning into your next backlog card.

If you want to see where your own funnel is bleeding before your next grooming session, start with the free marketing audit, or run a free ad audit if creative fatigue is your suspicion. Landing page owners can grab a free landing page audit instead. Once you’ve seen what the platform surfaces, the Solo and Agency plans are worth a look for teams ready to run this on a weekly basis instead of a one-off.
Sources
- Growth experiment management system — Reforge
- Marketing backlog management and Approval Cycle Tax — Spike AI
- Test Planning Scenario Tool — MarketingSherpa
- Growth Experiment Tracker Dashboard — Notion template
- How do I build a marketing backlog? — Pedowitz Group
FAQ
What Is a Marketing Experiment?
A marketing experiment is a controlled test of a specific hypothesis, like a headline change or a new email flow, run against a defined metric to see whether it moves that metric in the predicted direction. It always includes a comparison point, whether that’s a previous baseline or a live control group.
What Are the Steps of the Experimental Method for Marketing Tests?
Most testing programs follow a version of: identify the problem, form a hypothesis, design the test, set the sample size and duration, run it, analyze the results, and document the insight. The Pedowitz Group playbook compresses this into collect, clarify, score, prioritize, refine, and measure for backlog purposes specifically.
What Are the Main Types of Marketing Experiments?
The three most common types are A/B tests (one variable changed against a control), multivariate tests (several variables tested in combination), and holdout tests (a segment excluded entirely to measure incremental impact). Each fits different situations depending on traffic volume and how many variables you’re trying to isolate.
What Are Some Examples of Growth Marketing Experiments?
Common examples include testing onboarding flow length, subject line variations in lifecycle email, landing page layout changes, and paid ad creative formats across platforms. A tool like Gleanit can help identify which of these areas is leaking the most value before you commit backlog capacity to testing it.
How Do I Prioritize a Marketing Experiment Backlog Without Endless Debate?
Score every idea with ICE or RICE using a consistent rubric, then rank by score divided by estimated effort so quick wins don’t get buried under bigger, slower projects. Re-score during weekly grooming rather than letting old scores go stale.
What’s the Difference Between ICE and RICE Scoring?
ICE scores Impact, Confidence, and Ease, while RICE adds Reach to account for how many people a change actually touches. RICE tends to work better once you’re comparing ideas across very different audience sizes, like a homepage test against a niche email segment.
Recommended
- 45 Minute LinkedIn Ads Competitor Audit for Agencies
- Campaign Post Mortem: A Repeatable Agency Template
- 30 Minute TikTok Ad Library Workflow for Agencies
- 2 Minute Capture Routine to Build an Ad Swipe File Agencies Use
Corrections: ovannes@hearye.co or our editorial policy.