
Check three things first: the Overview trends for the last 7 days, whether conversions are still recording, and whether budget pacing looks normal. If those three check out, your account is probably healthy. If any one is off, that’s where you start digging.
Most account problems announce themselves in exactly those three places before anything else breaks. A tracking failure shows up as a conversion count that suddenly flatlines. A budget problem shows up as spend that stalls out at noon instead of pacing through the day. And a relevance problem shows up in the Overview as impressions climbing while clicks stay flat.
Here’s the fast version, in order:
- Open Google Ads Overview and compare this week to last week for spend, clicks, and conversions.
- Confirm conversion tracking is still firing (check today’s count, not just the weekly total).
- Review budget pacing against the daily average to catch overspend or underspend early.
- Scan for disapproved ads or limited-by-policy statuses in the Ads tab.
- Pull the Search terms report for anything obviously irrelevant burning through spend.
Pro Tip: Save this as a five-minute daily routine using the Report Editor rather than rebuilding the view from scratch every morning. Once conversions and pacing look solid, move on to the deeper metric review below.
Key Takeaways
A healthy Google Ads account depends on checking Overview trends, verified conversion tracking, and budget pacing before touching any bid or targeting change.
| Point | Details |
|---|---|
| Start with the Overview | Compare the last 7 days to the prior 7 days before drilling into Campaigns or Keywords. |
| Verify tracking before trusting metrics | Test conversion tags with the Test button and confirm GCLID appears on real clicks. |
| Use ValueTrack for attribution | Add parameters like {device} and {matchtype} to tracking templates to capture click-level detail. |
| Diagnose before you react | Use Explanations and Change History to find the real cause of a sudden metric shift. |
| Scale monitoring with automation | Platforms like Gleanit automate alerts and prioritize fixes across multiple client accounts at once. |
Table of Contents
- Where to View Google Ads Performance Data
- What Google Ads Metrics Matter Most, and When to Act
- How Do You Set Up and Test Google Ads Conversion Tracking?
- Setting Up URL Tracking Templates and ValueTrack Parameters
- Building Reports and Dashboards for Ongoing Monitoring
- How to Interpret Sudden Changes in Google Ads Performance
- Monitoring Google Ads From Your Phone
- How Agencies Scale Google Ads Monitoring Across Clients
- How to Monitor and Optimize Audience Targeting Effectiveness
- Best Practices for Monitoring Budget Pacing and Bid Adjustments
- A Realistic Monitoring Routine From Agency Practice
- Automated Google Ads Monitoring Built for Agencies
- Frequently Asked Questions
- Sources
Where to View Google Ads Performance Data
You monitor Google Ads by working through five views, each one narrower than the last: Overview, Campaigns, Ad groups, Ads, and Keywords. Each layer answers a different question, and skipping straight to Keywords without checking Campaigns first is how people miss the obvious problem.
- Overview page. This is your starting point every time. It defaults to showing performance for the last 7 days compared to the prior 7 days, which is enough to spot a trend before it becomes a crisis.
- Campaigns tab. Sort by cost or conversions to find which campaign is driving (or draining) the account. This is where budget-level decisions get made.
- Ad groups tab. Compare ad groups within a campaign to see if one is carrying the weight while others sit idle.
- Ads tab. Check ad strength, approval status, and which specific creative is winning.
- Keywords and Search terms. The Search Keywords tab shows what you’re bidding on; the Search terms report shows what people actually typed to trigger your ad; those two lists diverge more than most advertisers expect.
Customize your columns before you do anything else. At minimum, show clicks, impressions, CTR, average CPC, conversions, conversion value, cost per conversion, and impression share. Add these as custom columns if they’re not visible by default. This single change turns a five-minute glance into an actual diagnostic session.
[!SCREENSHOT: Insert an annotated screenshot of the Google Ads Overview page here, with callouts pointing to the 7-day comparison chart and the recommendations panel.]
If you’re checking the same five or six columns every day, stop rebuilding the table manually. The Report Editor lets you save a drag-and-drop view with your exact columns, segments, and date range, so your daily check becomes a single click instead of a five-step navigation.
The Overview tells you that something changed. The Campaigns and Ad groups tabs tell you where. The Search terms report tells you why. Skip a layer and you’re guessing.
What Google Ads Metrics Matter Most, and When to Act
Not every metric deserves the same attention every day. Impressions and clicks matter for context, but conversion rate, CPA, and Impression Share are what actually tell you whether to change something. Here’s what each metric measures and the point at which it’s worth stopping to act.
| Metric | What it measures | When to act |
|---|---|---|
| Impressions | How often your ad was shown | Sudden drop of 30%+ often signals a budget cap, disapproval, or Quality Score issue |
| Clicks | Raw traffic volume to your site | Falling clicks with flat impressions usually points to ad copy or ranking loss |
| CTR (click-through rate) | Percentage of impressions that became clicks | Below 1% on Search generally means weak ad relevance or wrong match types |
| Avg. CPC | Average cost paid per click | A spike with no bid change often means increased competition or lower Quality Score |
| Conversions | Completed goal actions (purchases, leads, calls) | Any unexplained drop to near zero means check tracking first, budget second |
| Conversion rate | Conversions divided by clicks | A drop with steady traffic points to landing page or offer misalignment |
| CPA (cost per acquisition) | Cost divided by conversions | Rising CPA with flat conversion volume signals bid or targeting drift |
| ROAS (return on ad spend) | Revenue divided by ad spend | Below your break-even ROAS for more than a few days warrants a bid or budget change |
| Quality Score | Google’s relevance rating | A score of 5 or below on a keyword usually means the ad or landing page needs work |
| Impression Share | Percentage of available impressions you actually got | Losing share to budget rather than rank means you’re leaving cheap conversions on the table |
A few of these deserve a bullet-level explanation, since the “why” matters more than the number:
- CTR under 1% on Search almost always means the ad text doesn’t match search intent, or you’re bidding on broad match terms that are too loosely related to the offer.
- Conversion rate drop with stable traffic is a landing page problem nine times out of ten: check for a broken form, a slow load time, or a recent design change.
- CPA creeping up week over week without a bid change usually means auction competition increased, or your Quality Score slipped and you’re paying a premium for the same position.
- Impression Share lost to budget (not rank) is the easiest fix on this list: raise the daily budget or shift spend from an underperforming campaign.
There’s no universal benchmark that applies to every account.
How Do You Set Up and Test Google Ads Conversion Tracking?
Conversion tracking is the foundation everything else in this article depends on. If it’s broken, every metric above is measuring the wrong thing. Conversion data can be reviewed at the account, campaign, ad group, ad, or keyword level, but only if the tracking underneath it is actually working.
- Choose your conversion actions. Decide what actually counts: a purchase, a form submission, a phone call, an app install. Don’t track everything; track what maps to revenue or pipeline.
- Install the Google tag. Place it on every page of your site, either directly or through Google Tag Manager.
- Configure event snippets. Set the tag to fire on the specific action (a “thank you” page load, a button click, a form success event).
- Enable Enhanced Conversions where appropriate. This uses hashed first-party customer data to improve measurement accuracy as third-party cookies become less reliable, a meaningful upgrade for privacy-forward conversion measurement.
- Import offline conversions from your CRM if a meaningful share of your pipeline closes outside the browser (a sales call, a signed contract weeks later).
Once it’s installed, test it before you trust it:
- Use the Test button in the Google tag setup flow to confirm the tag fires correctly.
- Check for a GCLID parameter in the URL after a test click; if it’s missing, your tracking template or redirect is likely stripping it.
- Verify conversion counts appear at the campaign, ad group, ad, and keyword level within 24 to 48 hours of a real conversion.
Common failure points: a tag that’s installed but never fires, cookie consent banners blocking measurement before a user opts in, and Consent Mode configurations that model conversions inaccurately because the signals were never mapped correctly. If your consent banner blocks tracking, Consent Mode helps recover some of that signal through modeling, but it’s not a substitute for getting the initial setup right.
Setting Up URL Tracking Templates and ValueTrack Parameters
A tracking template lets you attach measurement data to your ads without touching the destination URL itself. That distinction matters when you’re running dozens of ads: update the template once at the account or campaign level, and every ad inherits the change without needing re-approval, since a tracking template built at the account, campaign, or ad group level applies to every ad underneath it.
The syntax always includes {lpurl}, the macro that preserves your actual landing page URL while everything else in the template handles tracking:
https://tracker.example.com/click?url={lpurl}&device={device}&network={network}
ValueTrack parameters fill in the blanks automatically at the moment of the click:
{device}records whether the click came from mobile, desktop, or tablet.{matchtype}shows whether the keyword matched as exact, phrase, or broad.{network}tells you if the click came from Search, Search Partners, or Display.{placement}identifies the specific site or app where a Display ad appeared.{keyword}and{gclid}tie the click back to the exact term and click ID for downstream analytics.
Pro Tip: Build one master tracking template at the account level with your full ValueTrack string, then only override it at the campaign level when a specific campaign needs a different destination path. It’s far easier to audit one template than fifty.
Parallel tracking changes the mechanics slightly: the user goes straight to your final URL while the click measurement happens behind the scenes, which is why pages load faster. It’s mandatory for Search, Shopping, Display, Video, and Performance Max campaigns, so if your click tracker isn’t compatible with that setup, you’ll lose data quietly instead of loudly.
- Confirm your click measurement provider explicitly supports parallel tracking.
- Test a live ad click and verify the redirect resolves in under a second.
- Confirm the GCLID still appears in your analytics platform after the redirect completes.
A vendor worth checking on this is BeyondClix, which covers practical click-measurement considerations for teams running parallel tracking across multiple ad platforms.
Building Reports and Dashboards for Ongoing Monitoring
Manual checks work fine until you’re managing more than one or two accounts. At that point, a saved report or a scheduled export saves hours every week.
- Build a saved view in the Report Editor with your core columns and segment by device, location, and time of day.
- Add filters for campaign status or spend threshold so the report only surfaces accounts that need attention.
- Set up a scheduled email export (CSV or Google Sheets format both work) so the report lands in your inbox without a login.
A few things worth doing right the first time:
- Segment by device to catch mobile versus desktop performance gaps that aggregate numbers hide.
- Segment by time of day if you suspect conversion quality drops during certain hours.
- Save separate report templates for daily glance-checks and weekly deep dives; they don’t need the same columns.
Pro Tip: If you’re managing reporting across five or more accounts, a connector into Looker Studio (or a dedicated monitoring platform) beats manually exporting from the Google Ads UI every time. The UI is fine for one account; it becomes a bottleneck at scale.
How to Interpret Sudden Changes in Google Ads Performance
A sudden spike or drop is data, not a verdict. Work through this before you touch a bid or pause a campaign.
- Check your date range and filters first. A huge share of “emergencies” are just a comparison window set wrong.
- Open Explanations on the metric that moved. Google often auto-attributes drops to auction dynamics, budget limits, or eligibility changes.
- Verify tracking is still firing and that the landing page hasn’t changed or broken.
- Check budget pacing and any recent bid adjustments made by you or an automated rule.
- Use Change History to line up the timing of the shift against any account edits, since a bid change or a budget cut three days ago is often the real cause of a drop you’re only noticing today.
Pro Tip: Before escalating anything internally, screenshot the Explanations panel. It saves you from re-diagnosing the same drop twice when a teammate asks what happened.
Escalate immediately if you see: tracking that’s completely broken, spend that’s several multiples above the normal daily average with no clear cause, or a policy suspension notice on the account.
Monitoring Google Ads From Your Phone
The Google Ads mobile app covers the urgent stuff: checking conversions, applying recommendations, pausing an underperforming campaign, adjusting a budget, or reviewing your optimization score between meetings.
- Set up automated rules for spend pacing (pause if daily spend exceeds a set amount) and for low Impression Share alerts.
- Use push notifications for conversion drops or budget caps hit, not for routine performance updates that can wait.
- Treat the app as your triage tool: pause, adjust budget, dismiss a false alarm. Save keyword research, tracking template edits, and Report Editor work for the desktop interface, where the screen real estate actually helps.
How Agencies Scale Google Ads Monitoring Across Clients
Checking one account by hand takes five minutes. Checking thirty accounts by hand takes half a day, and that’s the point where agencies stop doing it manually and start automating the checks instead.
- Automated alerts flag pacing issues, conversion drops, and disapproved ads the moment they happen, not the next time someone opens the account.
- Prioritization logic ranks which issues actually cost money, so a teammate isn’t sorting through forty low-impact notifications to find the one that matters.
- Routing sends the right alert to the right person: a tracking failure goes to whoever owns analytics, a creative issue goes to whoever owns the ad copy.
The accounts that stay healthy long-term aren’t the ones checked most often. They’re the ones where the right person sees the right problem within hours instead of days.
Platforms built for this, Gleanit included, generally combine automated checks (like GCLID validation) with cross-platform funnel tracking so the alert already tells you where in the journey things broke, not just that something did.
How to Monitor and Optimize Audience Targeting Effectiveness
Audience performance hides inside aggregate numbers unless you go looking for it. A campaign with a healthy average CPA can still have one audience segment burning budget at triple that rate while another quietly outperforms everyone.
Break out performance by audience segment (in-market, custom intent, remarketing, similar audiences) and compare CPA and conversion rate across each one, not just the campaign total. It’s common to find that one segment is responsible for the majority of conversions while two or three others are essentially dead weight.
Once you spot that pattern, don’t just pause the underperformers. Check overlap first. Audiences frequently compete against each other in the same auction, which inflates costs on both sides without adding incremental reach. Google Ads shows audience overlap data inside the Audience insights section, and it’s worth checking before assuming a segment is genuinely underperforming rather than just cannibalized.
For the segments that work, expand deliberately. Use similar audiences built from your best-converting remarketing list, or layer a working in-market audience onto a new campaign rather than starting from a cold broad-match setup. Retest audience performance every few weeks, since audience behavior shifts with seasonality and your own remarketing list composition changes as it grows or ages out old visitors.

Best Practices for Monitoring Budget Pacing and Bid Adjustments
Budget pacing problems are sneaky because they don’t show up as a metric drop. They show up as a campaign that simply stops spending at 2 p.m. every day, quietly capping your reach without triggering any obvious alarm.
Check daily spend against your monthly budget divided by days remaining, not just against the daily budget setting itself. A campaign can hit its daily cap every single day and still underspend the monthly allocation if the daily number was set too conservatively at the start of the month.

When pacing runs consistently under budget, look at Impression Share lost to budget before you touch bids. If the account is losing impression share to budget rather than to rank, raising the budget captures more of what’s already working. If it’s losing to rank, a budget increase won’t help; that’s a bid or Quality Score problem instead.
When pacing runs consistently over budget, check whether a recent bid strategy change (switching to Maximize Conversions, for instance) is pulling spend forward faster than expected. Automated bidding strategies need real conversion volume and time to calibrate, generally two to three weeks, so give a bid strategy change a full learning window before deciding it’s the culprit.
Compounding adjustments before the first one settles is how accounts end up oscillating between overspending and underspending without ever finding the right level.
A Realistic Monitoring Routine From Agency Practice
Most accounts don’t need constant attention; they need consistent attention. A workable rhythm looks like this:
- Daily (5 minutes): Overview trends, conversion counts, budget pacing, disapproved ads.
- Weekly (20 to 30 minutes): Search terms review, Quality Score check, audience segment performance, Impression Share trends.
- Monthly (deeper session): Change History review against performance, tracking template audit, and a fresh look at whether your benchmarks still match the account’s actual 90-day averages.
The daily check catches emergencies. The weekly check catches drift. The monthly check catches the slow stuff that never trips an alert but quietly erodes performance anyway.
Automated Google Ads Monitoring Built for Agencies
Running that daily and weekly routine across one account is manageable by hand. Running it across fifteen or fifty client accounts is where manual checks start missing things, and that’s the exact gap Gleanit was built to close.
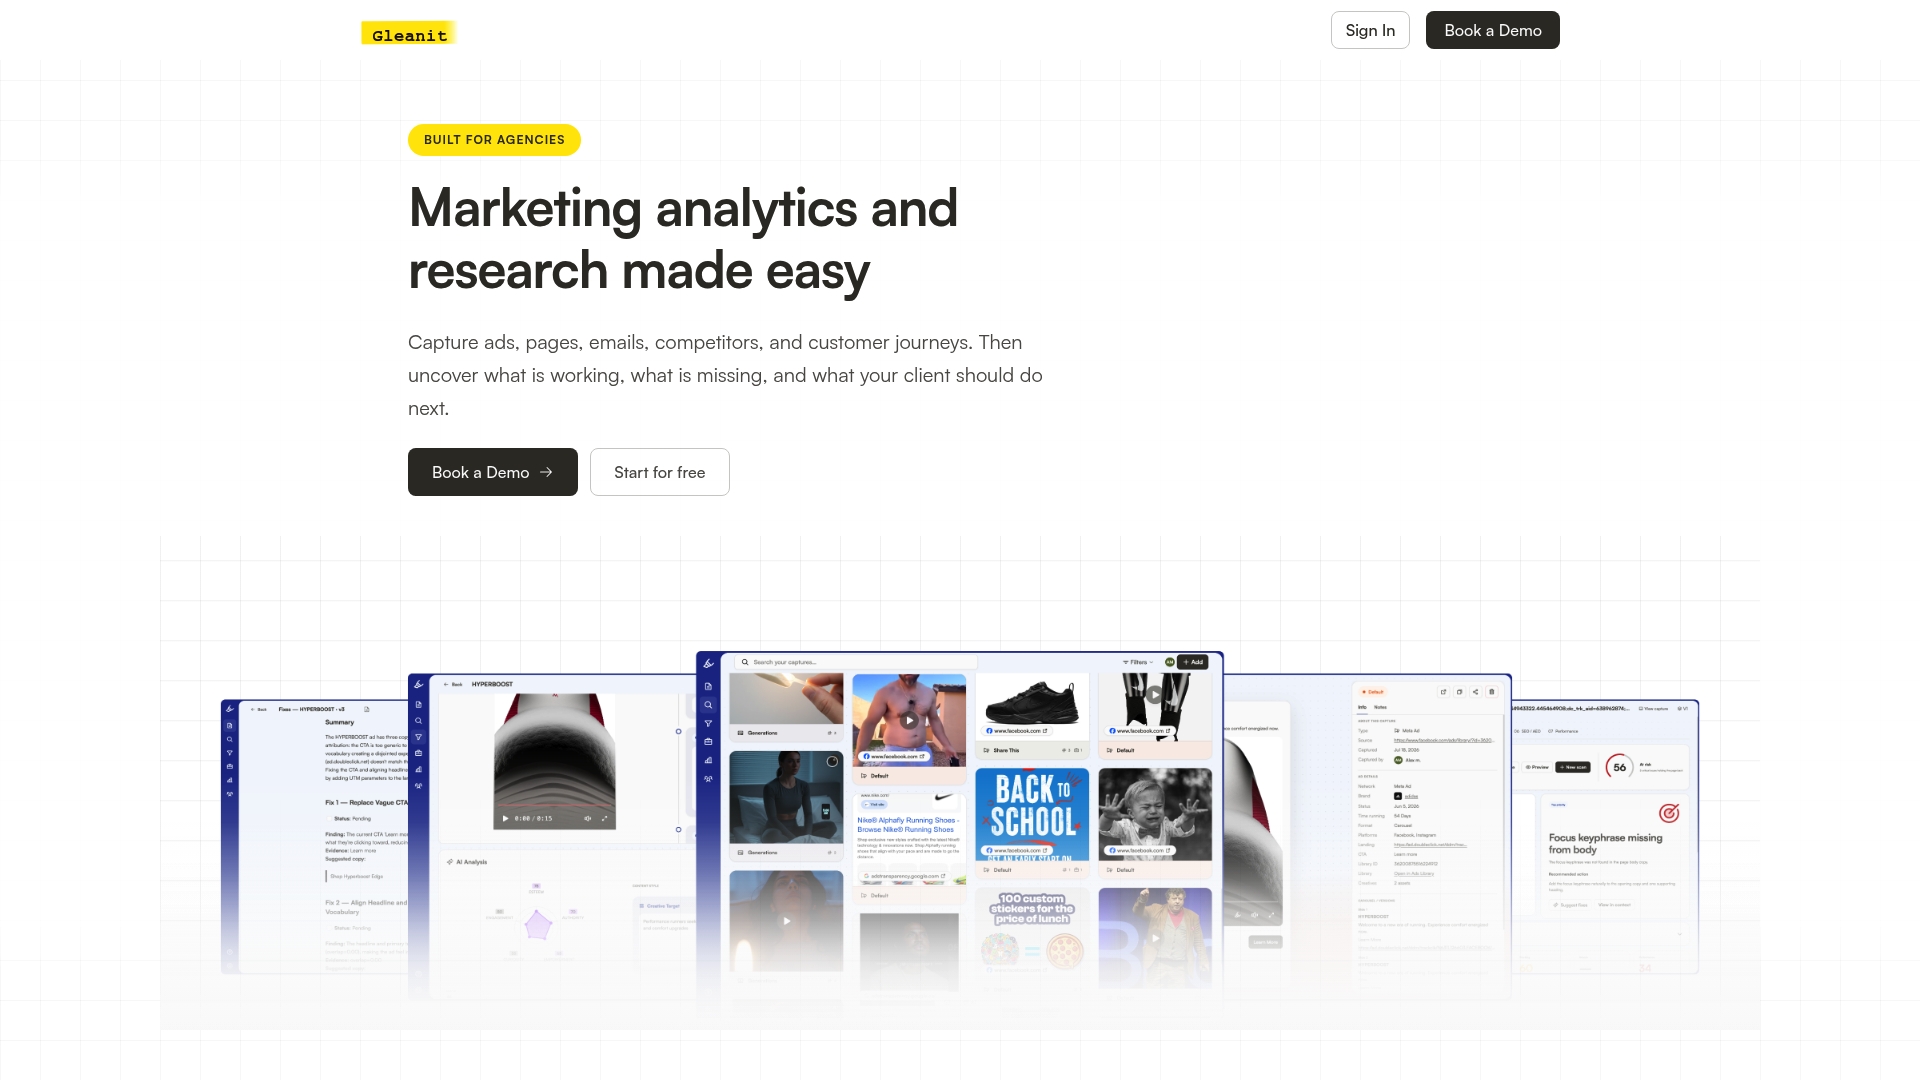
Instead of logging into each account separately to check pacing, conversions, and disapprovals, Gleanit automates those checks across every client workspace and surfaces the ones that actually need attention. A few specifics:
- Automated alerts flag pacing issues, conversion drops, and tracking failures the moment they happen, not the next time someone remembers to log in.
- Cross-channel funnel diagnostics connect what’s happening in Google Ads to Meta, TikTok, and LinkedIn, so you see the full customer journey instead of one platform in isolation.
- Prioritized recommendations rank which fixes actually move revenue, instead of leaving your team to sort through a long list of minor flags.
If you’re managing monitoring across multiple client accounts right now, start a free trial with Gleanit and see which of your accounts have been quietly drifting without anyone noticing.
Frequently Asked Questions
How often should I monitor my Google Ads account? Check pacing, conversions, and the Overview daily, run a deeper Search terms and Quality Score review weekly, and audit tracking templates and Change History monthly.
What’s the fastest way to tell if Google Ads tracking is broken? Run a test click, check for a GCLID in the URL, and confirm the conversion appears in the account within 24 to 48 hours; if it doesn’t, the tag or the tracking template is the likely culprit.
Which Google Ads metric should I watch most closely? Conversion rate and CPA tell you the most about actual account health, since impressions and clicks can look fine while the campaign quietly loses money.
Can I monitor Google Ads from my phone? Yes. The Google Ads mobile app lets you check conversions, pause campaigns, adjust budgets, and receive real-time alerts, though tracking template edits and deep reporting still work best on desktop.
Do I need parallel tracking set up manually? No. Parallel tracking is mandatory and automatic for Search, Shopping, Display, Video, and Performance Max campaigns; you just need to confirm your click measurement provider supports it.
Sources
- See account level performance and recommendations - Google Ads Help
- Set up and track conversions - Google Ads Help
Recommended
Corrections: ovannes@hearye.co or our editorial policy.