
Multi-touch attribution (MTA) is a measurement method that distributes conversion credit across every marketing touchpoint a customer encounters before converting, rather than crediting only one. For most teams starting out, the right move is to deploy a rules-based linear or position-based model first to establish a baseline, then graduate to algorithmic approaches once you have clean, user-level data at scale.
MTA directly informs three decisions that matter most to marketing teams:
- Budget allocation: Which channels and campaigns deserve more spend based on their actual contribution to conversions, not just the last click.
- Creative optimization: Which ad formats, messages, and sequences drive assists and final conversions across the funnel.
- Audience sequencing: How to order touchpoints and retargeting logic to move prospects through the funnel more efficiently.
Key Takeaways
Multi-touch attribution gives marketing teams a more accurate picture of channel contribution than any single-touch model, but its value depends entirely on data quality and validation discipline.
| Point | Details |
|---|---|
| Start with rules-based models | Linear or position-based models give reliable baselines without requiring large datasets or engineering resources. |
| Algorithmic models need clean data | Markov and Shapley approaches require at least 500 conversions before results are stable. |
| Validate before reallocating | Run holdout or incrementality tests before moving significant budget based on attribution outputs alone. |
| MTA and MMM are complementary | Use MMM for strategic budget allocation across media types; use MTA for in-channel and creative optimization. |
| Gleanit automates agency-grade MTA | Gleanit ingests multi-platform data, flags funnel gaps, and generates client-ready attribution reports automatically. |
Table of Contents
- What is multi-touch attribution and why does it matter?
- How do rules-based multi-touch models work?
- How do algorithmic attribution models work?
- How do you choose the right MTA model?
- What data and infrastructure does MTA actually require?
- How do you implement MTA step by step?
- How do you validate MTA outputs and govern the model?
- How does MTA differ from Marketing Mix Modeling?
- What are the most common MTA pitfalls?
- What does MTA look like in practice?
- How Gleanit approaches MTA in production
- An honest take on where most teams go wrong
- Gleanit gives agencies a faster path to reliable attribution
- Sources
What is multi-touch attribution and why does it matter?
Single-touch attribution, whether first-click or last-click, treats the customer journey as a single moment. That’s a fiction. Most buyers interact with a brand through paid search, organic content, social ads, email, and direct visits before they convert. Crediting only one of those touchpoints doesn’t just misrepresent the journey; it actively misleads budget decisions.
Multi-touch attribution distributes fractional credit across all recorded touchpoints in a conversion path. The unit of analysis is the conversion event and the sequence of touchpoints that preceded it. Each model applies a different logic for how credit is split, ranging from equal shares to weighted distributions based on position, time, or statistical contribution.
There’s an important distinction worth making early: credit allocation is not the same as causal impact. MTA tells you how much credit a model assigns to each channel given its rules or algorithm. It does not, by itself, prove that removing a channel would reduce conversions by that exact amount. That’s where incrementality testing comes in, and it’s a validation step most teams skip too soon.
The business case for MTA is concrete. According to WhatConverts, MTA reveals assisting touchpoints and channel combinations that single-touch metrics miss entirely, enabling better cross-channel optimization and full-funnel decision-making. Without MTA, you cut it and wonder why conversion rates drop.
Pro Tip: Align your MTA output to the KPI your business actually optimizes. If you’re measuring revenue, make sure your model weights conversions by deal value, not just conversion count. A model calibrated to lead volume will mislead you if high-value deals follow different paths than low-value ones.
Rules-based models, as Nielsen’s attribution research documents, provide interpretable credit distributions that work well for diagnostics and teams with limited data. Algorithmic approaches go deeper but require more infrastructure. The right starting point depends on what decisions you need to make and what data you already have.
How do rules-based multi-touch models work?
Rules-based models apply a fixed, human-defined logic to split credit. No machine learning, no statistical modeling. That simplicity is both their strength and their ceiling.
The five core models
It’s useful when your primary question is “what drives awareness and new customer acquisition?” It systematically ignores everything that happened after the first interaction, which makes it a poor fit for evaluating nurture or retargeting.
It’s the default in most ad platforms and analytics tools. It’s easy to explain to stakeholders, but it chronically over-credits direct traffic, branded search, and retargeting while starving upper-funnel channels of any recognition.
Linear splits credit equally across all touchpoints. It’s the fairest starting point when you have no strong prior about which touchpoints matter most, and it’s the model Twilio recommends for teams beginning their MTA journey before moving to fractional approaches.
It reflects the intuition that acquisition and conversion moments are most important, with assists playing a supporting role.
Time-decay gives more credit to touchpoints closer to conversion, typically using an exponential decay function with a half-life of seven days. It suits short sales cycles where recency genuinely signals intent.
A worked example
Say a customer converts after three touchpoints: a Facebook ad (Day 1), an email (Day 5), and a Google branded search (Day 7).
The differences are stark. Facebook gets everything under first-touch and nothing under last-touch. That’s not a measurement difference; it’s a completely different story about what drove the sale.
Comparing rules-based models
Nielsen’s guide to attribution methods confirms these models are standard heuristics valued for their interpretability, not their statistical rigor.
| Dimension | First/Last-touch | Linear | Position-based | Time-decay |
|---|---|---|---|---|
| Explainability | Very high | High | High | Medium |
| Data needed | Minimal | Minimal | Minimal | Timestamps required |
| Best for | Awareness or conversion audits | Baseline diagnostics | Balanced funnel view | Short-cycle campaigns |
| Rebuild cadence | On demand | Weekly/monthly | Weekly/monthly | Weekly |
| Complexity | Very low | Low | Low | Low |
Rules-based models are a defensible choice when your channel set is small (fewer than five channels), your data is incomplete, or you need a fast diagnostic without engineering resources. They’re not a permanent solution for teams making large budget moves.
How do algorithmic attribution models work?
Algorithmic models replace human-defined rules with statistical or machine-learning methods that learn credit weights from the data itself. The trade-off: they require larger, cleaner datasets and more technical skill to implement and interpret.
Markov chain models
A Markov model maps the customer journey as a sequence of states (touchpoints) and estimates the probability of moving from one state to the next, ultimately reaching a conversion or dropping off. Credit is assigned by calculating the “removal effect”: how much does conversion probability drop if you remove a given channel from all paths?
The output is a channel-level weight table showing each channel’s marginal contribution to conversion probability. Markov models handle path order and channel combinations naturally, which rules-based models cannot. They work well with a few thousand conversion paths, though more data improves stability.
Shapley value / fractional attribution
Shapley value comes from cooperative game theory. It asks: across every possible combination of channels, what is each channel’s average marginal contribution? The result is a fair, mathematically grounded credit split that accounts for channel interactions.
Nielsen’s research notes that Shapley-value approaches and Bayesian models like the Li and Kannan framework consider marginal contributions across channel combinations, which reduces bias from conditional spend patterns. The cost is compute time and data volume. Shapley calculations grow exponentially with the number of channels, so teams with more than eight to ten channels typically need approximation methods.
Incrementality and holdout experiments
Incrementality testing is the only method that directly measures causal lift. You split your audience into exposed and holdout groups, run your campaign to the exposed group, and measure the conversion difference. The holdout group’s conversion rate represents what would have happened without the channel.
This is not an attribution model in the traditional sense. It doesn’t produce per-touchpoint credit splits. It answers a different question: “Does this channel actually cause incremental conversions, or are those people converting anyway?” That’s a more valuable question for large budget decisions.
ML and logistic regression approaches
Logistic regression and gradient-boosted models can predict conversion probability given a sequence of touchpoints, then use feature importance or SHAP values to assign credit. These approaches can operate at the keyword, placement, or creative level and can be rebuilt daily in some setups, as Nielsen documents.
Comparing algorithmic models
| Model | Strengths | Data requirements | Interpretability | Rebuild cadence |
|---|---|---|---|---|
| Markov chain | Handles path order, removal effects | Thousands of paths | Medium | Weekly/monthly |
| Shapley value | Mathematically fair, handles interactions | Large, clean datasets | Medium | Weekly |
| Incrementality | Causal, not correlational | Holdout-eligible campaigns | High (binary lift) | Per campaign |
| ML/logistic regression | Granular, keyword/creative level | Large user-level datasets | Low to medium | Daily possible |
Pro Tip: Choose incrementality when you’re deciding whether to keep or cut a channel entirely. Choose fractional attribution (Markov or Shapley) when you need to optimize spend across channels you’ve already committed to running. They answer different questions and should be used together, not interchangeably.
What algorithmic output looks like
A Markov model output for a five-channel mix might look like this:
Channel         | Removal Effect | Attributed Conversions | Share
----------------|----------------|------------------------|------
How do you choose the right MTA model?
Model choice is a function of what decision you need to make, not which model sounds most sophisticated. A Shapley model you can’t validate is worse than a linear model you understand.
Decision checklist
Work through these questions before selecting a model:
- What decision will this output drive? Budget reallocation, creative testing, or channel sequencing each require different precision levels.
- How long is your sales cycle? Cycles under two weeks favor time-decay or last-touch. Cycles over 30 days need position-based or algorithmic models.
- How many channels are you measuring? Fewer than five channels: rules-based is sufficient. More than five: consider Markov or Shapley.
- Do you have user-level data? No user-level data means algorithmic models are off the table. Start with rules-based.
- What’s your monthly conversion volume? Fewer than 500 conversions per month: algorithmic models will be unstable. Rules-based is the right call.
- What are your privacy constraints? GDPR and CCPA limit user-level tracking. If you’re operating without third-party cookies, you’ll need server-side tracking or modeled approaches.
- What’s your team’s technical skill? Markov and Shapley require Python or R proficiency. Rules-based models run in any BI tool.
Model-selection heuristics
- Short B2C cycle, high volume: Time-decay or last-touch for quick wins; Markov when you want to understand assist patterns.
- Complex B2B pipeline (60+ day cycle): Position-based (W-shaped for lead-to-close) or account-level Shapley.
- Limited identity resolution: Rules-based linear; avoid algorithmic models until identity stitching is in place.
- Testing creative or placement: ML/logistic regression at the ad-unit level, rebuilt frequently.
WhatConverts recommends MTA specifically for cross-channel campaigns and longer buying cycles where awareness, mid-funnel engagement, and final triggers work together.
Pro Tip: Run your chosen model alongside last-touch for 30 days before acting on the output. If the two models agree on channel rankings, you have low-risk confirmation. If they diverge significantly, that divergence is itself a signal worth investigating before moving budget.
What data and infrastructure does MTA actually require?
This is where most MTA projects stall. The model math is the easy part. Getting clean, unified, user-level data is the hard part, and the AMA’s research on MTA implementation confirms that poor data hygiene is the most common reason projects fail.
Required data types
- Ad impressions and clicks (with timestamps, campaign IDs, and creative IDs)
- Page views and on-site behavioral events (tagged with session and user IDs)
- Email opens and clicks (linked to CRM contact IDs)
- CRM conversion events (with revenue values where available)
- Offline conversions (call center, in-store, if applicable)
- Cross-device signals (if available through first-party login or probabilistic matching)
Identity resolution
The central challenge is stitching these data sources to a single user. Three approaches exist:
Deterministic stitching uses a known identifier, typically a logged-in user ID, email hash, or CRM key.
Probabilistic stitching uses device fingerprinting, IP address, and behavioral signals to infer cross-device identity. It’s broader but introduces error rates that compound in algorithmic models.
Server-side tracking bypasses browser-level cookie restrictions by sending event data directly from your server to your data warehouse. It’s the most privacy-resilient approach and increasingly necessary as third-party cookies phase out across browsers.
Google Ads’ data-driven attribution documentation explicitly notes cross-device tracking limits and measurement-window effects that constrain what any platform-native attribution model can see.
Instrumentation checklist
- Consistent UTM taxonomy across all paid channels (source, medium, campaign, content, term)
- Named event schema with deduplication keys (event ID + user ID + timestamp)
- Server-side event forwarding for key conversion events
- CRM-to-web session mapping (email hash or user ID passed through form submissions)
- Defined attribution window (typically 30 or 90 days for B2B; 7 or 14 days for B2C)
Data architecture options
Twilio’s MTA implementation guide documents that many teams use a hybrid stack: Segment for event collection, Snowflake or BigQuery as the warehouse, and Looker or Tableau for visualization. That stack handles most MTA use cases at mid-market scale.
| Architecture | Best for | Trade-offs |
|---|---|---|
| CDP + warehouse (Segment + Snowflake) | Mid-market, multi-channel | Setup time 4–8 weeks; ongoing cost |
| Native platform attribution (Google, Meta) | Single-platform campaigns | Walled garden; no cross-channel view |
| Open-source (Python MTA library + warehouse) | Technical teams, prototyping | High engineering time; no UI |
| Commercial MTA vendor | Enterprise, complex journeys | High cost; faster time-to-value |
If either condition fails, your model will overfit to noise. Run rules-based models until you hit those floors.*
How do you implement MTA step by step?
Implementation has six phases. Skipping any of them creates technical debt that surfaces as model instability six months later.
Build vs. buy
The decision comes down to time-to-value and team capability. Building in-house with open-source libraries like the MTA Python library on GitHub, which implements Markov, Shapley, and rules-based models, is viable for technical teams that want to prototype before committing to a vendor. Expect four to eight weeks of engineering time to get a working prototype. A commercial solution compresses that to two to four weeks but adds license cost.
Implementation timeline
- Discovery (weeks 1–2): Audit existing tracking, map conversion events, define attribution windows, and document identity resolution gaps.
- Instrumentation (weeks 3–6): Implement server-side tracking, standardize UTM taxonomy, deploy deduplication logic, and connect CRM to web data.
- Data modeling (weeks 5–8): Build the touchpoint table in your warehouse, resolve identities, and validate path completeness.
- Model selection and build (weeks 7–10): Run rules-based models first as a baseline, then prototype algorithmic models if data thresholds are met.
- Validation (weeks 9–12): Run a holdout experiment on one channel to sanity-check model outputs against measured lift.
- Deployment and monitoring (week 12+): Automate model rebuilds, set up drift alerts, and establish a reporting cadence.
Roles required
- Data engineer: Instrumentation, warehouse pipelines, deduplication
- Marketing analyst: Model selection, output interpretation, reporting
- Marketing/product owner: Attribution window decisions, KPI alignment, stakeholder communication
- Privacy/legal: GDPR and CCPA compliance review, consent management, data retention policies
Quick wins to deliver early
- Replace last-touch with linear attribution in your BI dashboard within the first two weeks. It immediately surfaces assist channels.
- Flag any channel with zero last-touch credit but positive linear credit. Those are your undervalued channels.
- Build a path-length distribution report. If most conversions happen in one or two touchpoints, rules-based models are sufficient for now.
- Set up a weekly conversion path export from your warehouse. Even without a model, path data is immediately useful for creative sequencing decisions.
How do you validate MTA outputs and govern the model?
Attribution outputs are only as trustworthy as the validation behind them. Salesforce’s MTA best practices documentation is direct on this: attribution estimates are conditional on past spend and touchpoint patterns, and teams should validate with incrementality or holdout tests before reallocating major budgets.
Incrementality testing approaches
Geo holdouts split your target geography into test and control regions. Run your campaign in the test region and measure conversion rate differences. This works well for channels with broad reach like TV, display, or YouTube.
Randomized exposure holdouts suppress ads for a randomly selected user segment. The conversion rate difference between exposed and suppressed groups is the channel’s incremental lift. This is the gold standard for digital channels.
Campaign-level experimentation turns off a channel entirely for a defined period and measures the downstream effect on conversions. It’s blunt but effective for channels you’re considering cutting.
Monitoring checklist
- Weekly check on conversion volume per channel (alert if any channel drops more than 20% week-over-week without a corresponding spend change)
- Monthly model rebuild for rules-based models; weekly or bi-weekly for algorithmic models in fast-moving campaigns
- Quarterly reconciliation of MTA-attributed revenue against CRM-reported revenue and finance records
- Sample-size alert: flag any model run where the conversion count in the window falls below your minimum threshold
Governance best practices
- Document every model version with its parameters, data inputs, and attribution window
- Require analyst sign-off before any budget move exceeding a defined threshold (for example, more than 15% reallocation in a single channel)
- Maintain a decision log linking attribution outputs to budget changes and their measured outcomes
- Review model assumptions quarterly, especially after major channel mix changes or privacy regulation updates
Pro Tip: Combine attribution-derived channel weights with price elasticity estimates before making large reallocations. A channel with high attribution credit but low elasticity may not respond to additional spend the way the model implies. The two inputs together give you a more complete picture than either alone.
How does MTA differ from Marketing Mix Modeling?
These two approaches are often confused and occasionally positioned as competitors. They’re not. They answer different questions at different levels of granularity, and the AMA’s research on multi-touch attribution is clear: MTA is event-based and uses user-level first-party data to allocate fractional credit across touchpoints, while MMM is a top-down statistical approach for evaluating overall media spend including offline channels.
The core distinction
MTA works bottom-up: it starts with individual user paths and aggregates up to channel-level insights. MMM works top-down: it regresses aggregate spend data against aggregate outcomes (sales, revenue) over time, typically using weeks or months of data. MMM can include offline channels like TV and radio that MTA cannot track at the user level.
When to use each
| Dimension | MTA | MMM |
|---|---|---|
| Data type | User-level, event-based | Aggregated spend and outcome data |
| Best use case | Channel/creative optimization, sequencing | Strategic budget allocation across media mix |
| Explainability | Medium to high (rules-based) | High (regression coefficients) |
| Offline channels | No | Yes |
| Rebuild cadence | Weekly to daily | Quarterly to annually |
| Privacy sensitivity | High (user-level data required) | Low (aggregated data only) |
Using both together
The most effective approach is to run MMM for high-level budget allocation across your full media mix, including offline, and use MTA for in-flight optimization of digital channels and creative sequencing. MMM tells you how much to spend on digital vs. TV vs. out-of-home. MTA tells you how to allocate the digital budget across paid search, paid social, and email.
Pro Tip: Before reallocating a large budget based on MTA outputs, reconcile the MTA-derived channel mix with your MMM elasticity estimates. Use MTA for direction; use MMM for guardrails.
What are the most common MTA pitfalls?
Most attribution errors are predictable. Here’s where teams consistently go wrong and how to fix each one.
-
Data fragmentation: Touchpoints from different platforms (Meta, Google, email) are stored in separate silos with no common user ID. The fix is a unified identity layer, either through a CDP or a warehouse-side join on email hash or first-party ID.
-
Overreliance on last-touch: This is the default in most platforms and the most common source of upper-funnel budget cuts. The fix is running linear attribution in parallel and flagging channels where the two models diverge by more than 20 percentage points.
-
Survivorship bias: Your model only sees paths that converted. Non-converting paths are often excluded, which skews channel weights toward channels that appear in converting paths regardless of their actual contribution. The fix is including non-converting paths in Markov and ML models.
-
Incorrect deduplication: The same conversion is counted multiple times because different platforms each claim it. The fix is a canonical conversion table in your warehouse with a deduplication key, and a rule that platform-reported conversions are never summed directly.
-
Mis-specified attribution windows: A 7-day window for a 60-day B2B sales cycle will miss most of the touchpoints that actually mattered. The fix is setting your window based on your actual median time-to-conversion, pulled from CRM data.
-
Privacy-driven measurement gaps: GDPR and CCPA consent requirements mean a portion of your users are untracked. Google’s platform documentation acknowledges these gaps explicitly. The mitigation is using modeled conversions, aggregated measurement APIs (like Google’s Consent Mode), and server-side tracking for consented users to maximize signal.
Pro Tip: Watch for confirmation bias in model interpretation. If your MTA model confirms what you already believed about channel performance, that’s a reason to be more skeptical, not less. Run a sensitivity analysis: change one model parameter (the attribution window or the decay rate) and see if the channel rankings hold. If they flip, your conclusions are fragile.
What does MTA look like in practice?
Abstract model descriptions only go so far. Here’s how attribution analysis changes real decisions across three common scenarios.
-
B2C short-cycle (e-commerce): A retailer running paid search and paid social sees last-touch giving 80% of credit to branded search. Linear attribution reveals that Instagram ads are assisting 45% of converting paths but receiving near-zero last-touch credit. The team shifts 15% of branded search budget to Instagram prospecting and monitors conversion rate. The assist value was real; the budget move is validated by a holdout test two weeks later.
-
B2B long-funnel (SaaS): A software company uses a W-shaped model (40% first-touch, 40% opportunity-creation touch, 20% split across middle touches) to value both demand generation and sales development outreach. The model reveals that webinar attendance is the most common opportunity-creation touchpoint, not the demo request form. The team increases webinar promotion budget and adds a nurture sequence for webinar attendees who haven’t requested a demo.
-
Creative and placement optimization: An agency running display and video for a client uses a Markov model at the creative level. It finds that a specific 15-second video ad has a removal effect of 0.22, meaning conversion probability drops 22% when it’s absent from paths. The ad is not the final click; it’s a mid-funnel catalyst. The team scales its budget and uses it earlier in the retargeting sequence.
-
Account-level B2B attribution: For enterprise deals involving multiple stakeholders, standard user-level MTA misses the picture. Account-level attribution aggregates all touchpoints across everyone at a target company and assigns credit at the account level. This reveals that LinkedIn InMail and executive-targeted content play a larger role in enterprise deals than user-level models show.
How Gleanit approaches MTA in production
Agencies implementing MTA for multiple clients face a compounded version of every challenge described above: different data stacks per client, inconsistent tagging, and the need to produce attribution reports at scale without a dedicated data engineering team per account.

Gleanit’s onboarding process for agencies addresses this directly. The platform’s automated monitoring ingests ad data from Meta, TikTok, Google, and LinkedIn, then maps it against customer journey events to build a unified touchpoint view per client. Funnel gap diagnostics flag where identity resolution is breaking down or where attribution windows are misaligned with actual sales cycles.
The platform’s approach to MTA operationalization includes:
- Data ingestion: Automated pull from ad platforms and CRM sources, with deduplication rules applied at ingestion.
- Identity stitching: First-party ID matching across sessions and devices, with flagging when match rates fall below acceptable thresholds.
- Model selection guidance: Built-in recommendations based on conversion volume and channel count per client account.
- Reporting automation: AI-generated reports that surface attribution insights, funnel gaps, and prioritized recommendations in a format ready for client delivery.
- Integration points: Native connections to Slack, Discord, and Telegram for real-time alerts; Figma for report design; and compatibility with warehouse-based stacks for agencies running Snowflake or BigQuery.
For agencies evaluating platform readiness, the checklist looks like this:
- Does the platform ingest data from all channels your clients run?
- Can it resolve identity across sessions without requiring a custom engineering build?
- Does it flag data quality issues before running models, not after?
- Can it produce client-ready reports without manual formatting?
- Does it support holdout experiment tracking or integrate with your existing experimentation tools?
Pro Tip: Set a fixed reporting cadence for each client account before you start, not after. Weekly attribution snapshots with a monthly model review create a rhythm that makes governance automatic. Clients who see consistent, explained attribution outputs trust the numbers faster than those who receive ad hoc reports.
An honest take on where most teams go wrong
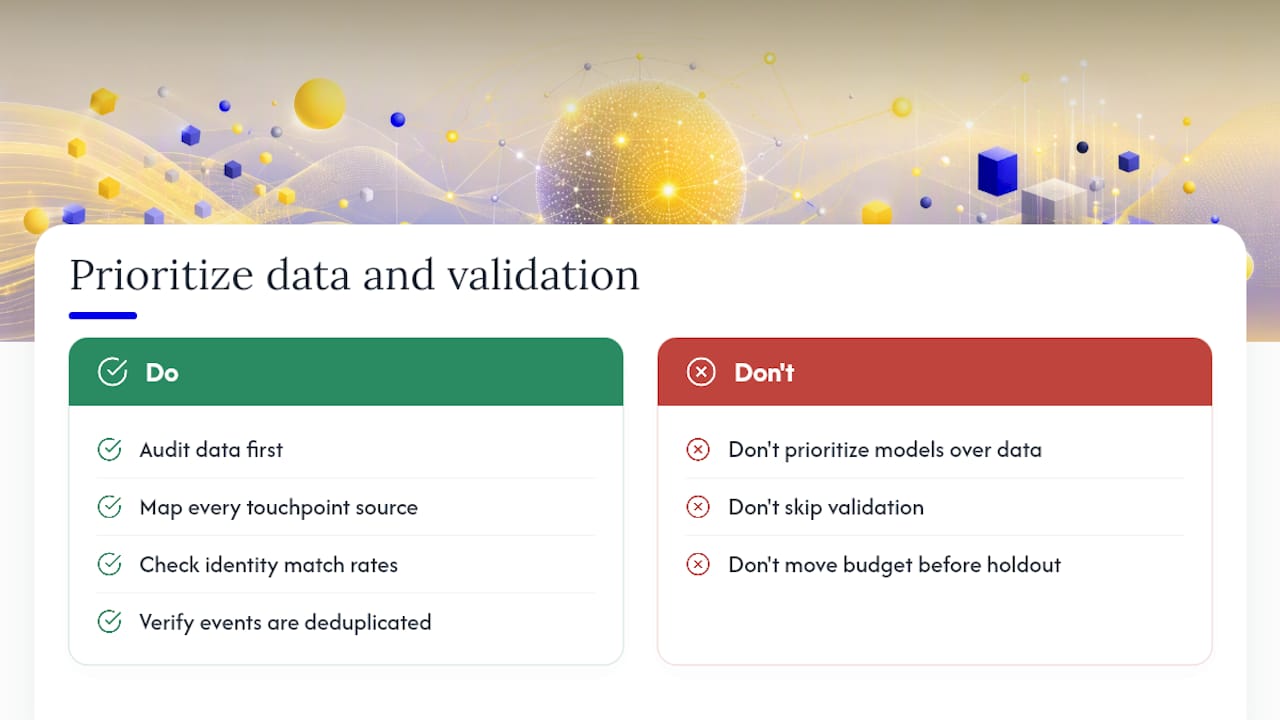
The biggest mistake in MTA isn’t choosing the wrong model. It’s treating model selection as the primary problem when data quality is the actual one. Teams spend weeks debating Markov vs. Shapley while their UTM parameters are inconsistent, their deduplication logic is broken, and their attribution window doesn’t match their sales cycle.
Start with the data audit. Map every touchpoint source, check identity match rates, and verify that your conversion events are deduplicated before you run a single model. A linear model on clean data will outperform a Shapley model on fragmented data every time.
The second mistake is skipping validation. Attribution outputs feel authoritative because they’re quantitative. It’s telling you display is correlated with conversion paths under the model’s assumptions. Holdout testing is the only way to move from correlation to causation, and most teams run their first holdout only after they’ve already made a budget move they later regret.
Start simple. Validate early. Scale the model complexity only when your data and your team are ready for it.
Gleanit gives agencies a faster path to reliable attribution
Agencies that manage attribution across multiple client accounts need a platform that handles data ingestion, identity resolution, and reporting without requiring a data engineer on every account. Gleanit was built for exactly that workflow.
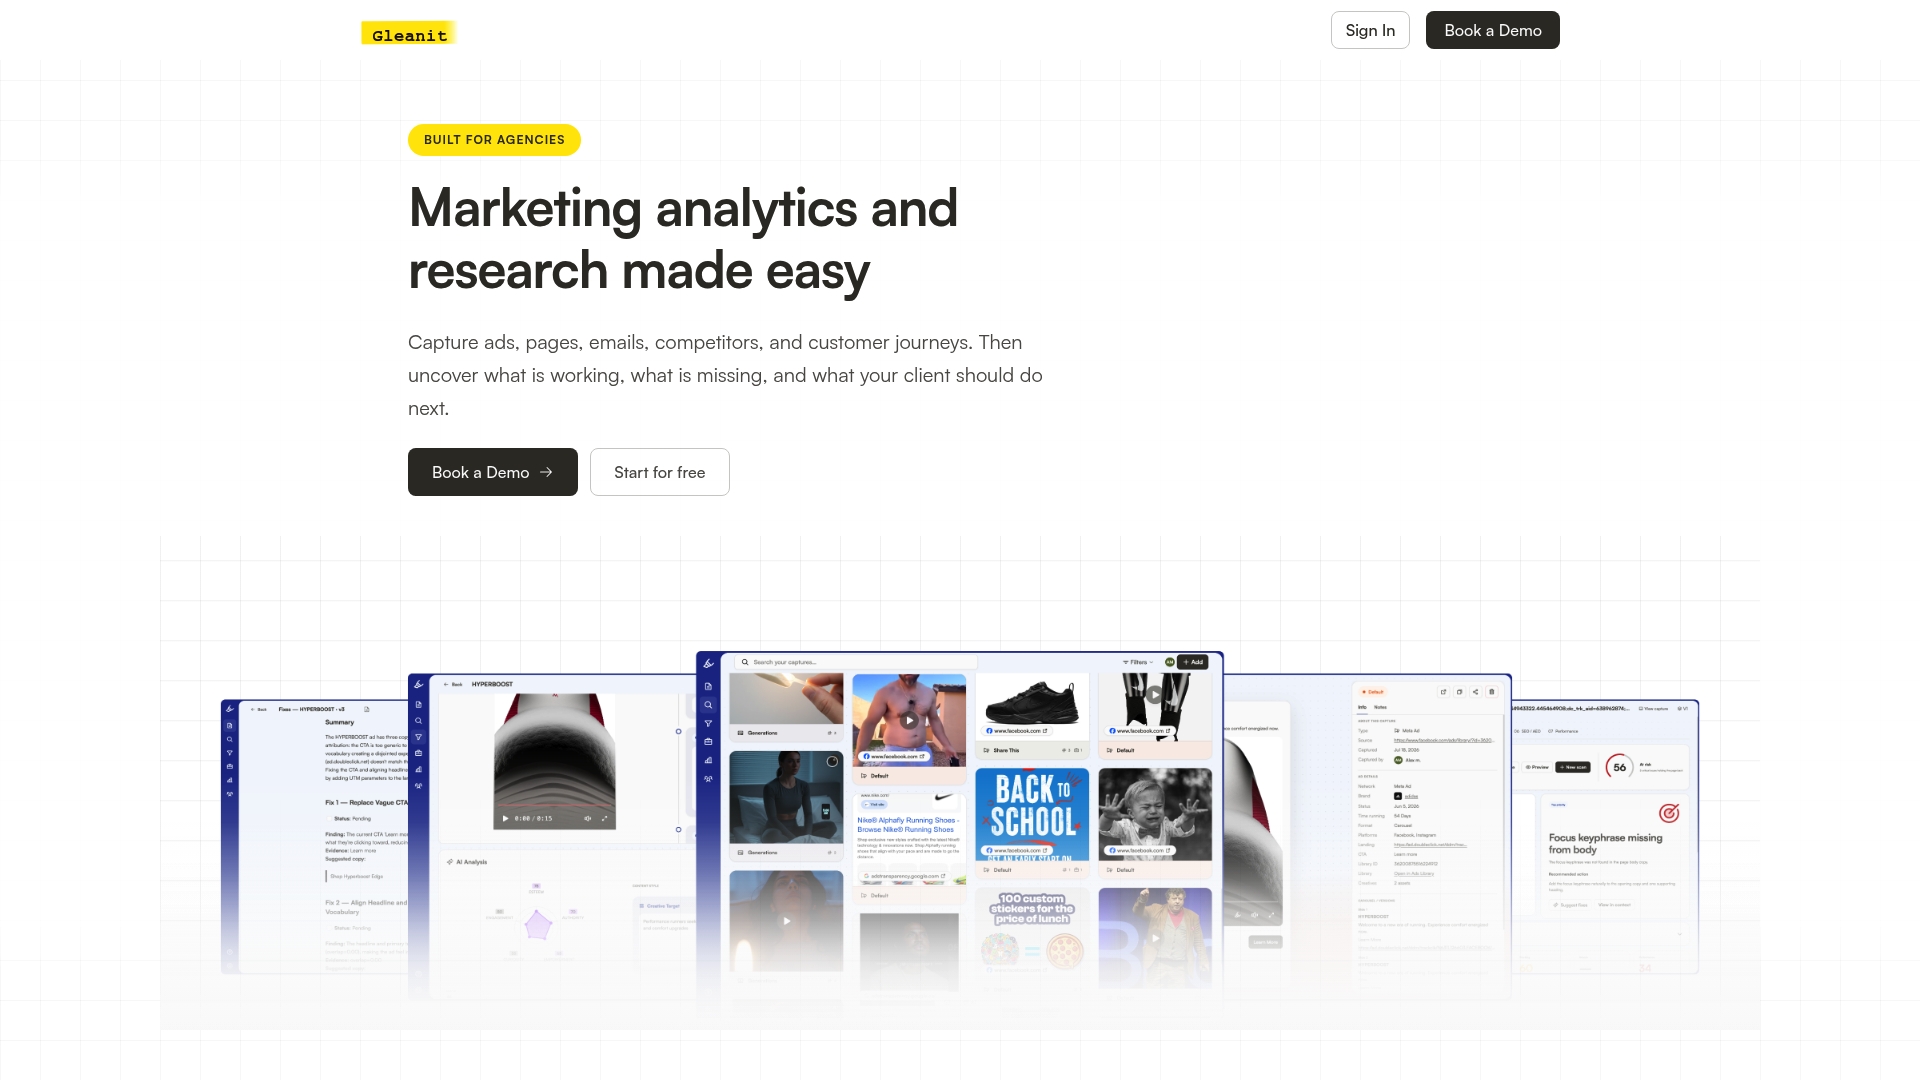
The platform connects to Meta, TikTok, Google, and LinkedIn, pulls touchpoint data automatically, and surfaces funnel gaps and attribution mismatches before they distort client reports. AI-powered report generation means your team spends time on strategy, not formatting. Weekly feature updates keep the platform current with platform API changes that would otherwise break your tracking.
If your agency is running attribution manually or relying on last-touch defaults inside ad platforms, start a free trial at Gleanit and see what a unified attribution view across all your client accounts actually looks like.
Sources
- Multitouch Attribution in the Customer Purchase Journey
- Methods & Models: A Guide to Multi-Touch Attribution
- Multi-Touch Attribution: What It Is & Best Practices | Salesforce
- Support
Recommended
Corrections: ovannes@hearye.co or our editorial policy.