
Fix the single binding constraint in your funnel before touching anything else, then sequence every other change so it feeds off that fix. Most marketing teams skip this and spread effort across ten problems at once, which is why nothing improves. Run a 10-minute constraint scan today, pick the one initiative that unblocks the most downstream value, and score everything else against it using a confidence-weighted formula, not a gut feeling.
TL;DR:
- Prioritize fixing the main constraint in your funnel before adding or changing other elements to ensure downstream improvements are effective.
- Use a simple scoring framework like ICE, RICE, or LICE that matches your team size and data availability, with a bias towards revenue proximity for more precise prioritization.
- Conduct a 60 to 90-minute workshop focusing on constraint identification, scoring, dependency mapping, and task assignment, supported by thorough pre-work.
- Fix tracking and attribution issues first, then improve landing pages and creative offers before scaling ad spend to avoid wasted efforts.
- Limit active initiatives to three to focus resources on the most impactful fixes and deliberately park or drop less critical items to maintain sequencing discipline.
Table of Contents
- Why Prioritizing Marketing Fixes Actually Moves Revenue
- Which Scoring Framework Should You Use: RICE, ICE, or LICE?
- How Do You Run a 60 to 90 Minute Prioritization Workshop?
- What Fixes Should You Make First When a Campaign Breaks?
- How Gleanit Turns This Workshop Into a Repeatable System
- How Does Marketing Prioritization Connect to Business KPIs?
- How Should Customer Feedback Shape What You Fix First?
- What Tools Help You Manage and Visualize Prioritization?
- What Do Successful Prioritization Sequences Actually Look Like?
- The Overlooked Part of Prioritization: Saying No on Purpose
- Turn This Workshop Into Action With Gleanit’s Free Audits
- Sources
- FAQ
Why Prioritizing Marketing Fixes Actually Moves Revenue
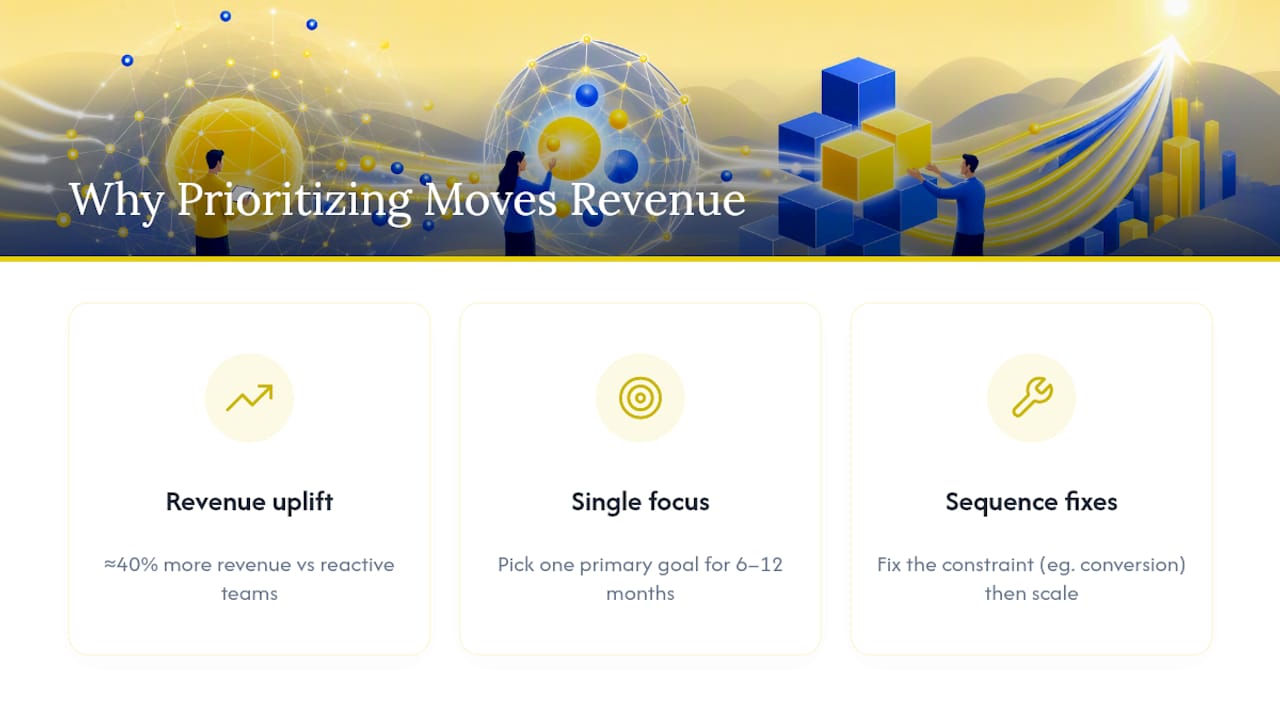
Marketing teams that run disciplined, continuous optimization programs generate materially higher revenue than teams that patch problems reactively. HubSpot’s research on digital marketing optimization points to roughly a 40% revenue uplift for companies that treat optimization as an ongoing discipline rather than an occasional cleanup project. That gap doesn’t come from working harder. It comes from working on the right thing first.
The Math Behind Disciplined Optimization Companies running structured, continuous marketing optimization see close to a 40% revenue uplift compared to those that optimize reactively, according to HubSpot’s optimization research.
The failure pattern shows up the same way across most teams. There’s no single agreed goal, so every stakeholder pulls the roadmap toward their own metric. Decisions get made on opinion instead of evidence, because nobody has a documented reason for why a landing page redesign beats a new ad set. And everyone runs five initiatives in parallel, which means none of them get the attention or sample size needed to produce a real signal.
Backlinko’s research on marketing strategy backs this up directly: teams should choose a single primary goal for 6 to 12 months and organize resourcing around the bottleneck that blocks it. Secondary goals are fine, but only when they don’t pull focus from the primary one.
Sequencing beats sprawl for a simple reason. If your landing page converts at 1% because the offer is unclear, spending money to drive more traffic to it just multiplies the waste. Fix the conversion leak, then scale spend. Fix the constraint, then optimize around it. Trying to do both at once is how teams burn a quarter’s budget and end the quarter with the same problems they started with.
Which Scoring Framework Should You Use: RICE, ICE, or LICE?
Pick a framework based on team size and how much data you actually have, not on which one sounds most sophisticated. Here’s how the three compare:
- ICE (Impact, Confidence, Ease) is the fastest to run. Three scores, usually 1 to 10, multiplied together. Best for small teams or quick weekly triage where you need a directional call, not a precise one.
- RICE (Reach, Impact, Confidence, Effort) adds a reach number, typically people affected per time period, which makes it more accurate for teams comparing initiatives across different audience sizes. It takes longer to score but produces defensible rankings when stakeholders disagree.
- LICE (Leverage, Impact, Confidence, Effort) swaps reach for leverage, how much a fix compounds into other parts of the funnel. Useful when you’re comparing structural fixes (tracking, attribution) against surface fixes (ad copy), since leverage captures downstream effect that reach alone misses.
None of these are wrong. They’re built for different levels of team maturity. A four-person in-house team doesn’t need RICE’s granularity. A 30-person growth team juggling twelve concurrent initiatives needs more than ICE’s gut-check simplicity.
For marketers who want something more tuned to revenue outcomes than the generic frameworks above, Spike’s prioritization model proposes a formula built specifically around proximity to revenue:
Score = (Revenue Proximity × Reach × Confidence) / Effort
Revenue proximity measures how close the fix sits to an actual transaction. A checkout page bug scores near the top. A brand awareness video sits lower, even if it “feels” important. Reach is the number of users or sessions the fix touches. Confidence is your evidence strength, scored low (guess), medium (directional data), or high (statistically significant test or repeated pattern). Effort is engineering or creative hours, scored on a simple 1 to 5 scale.
This formula matters because confidence sits as a multiplier, not an afterthought. A high-impact idea backed by nothing but a hunch gets discounted hard. A modest idea backed by three prior tests and a support ticket pattern gets pushed up. That’s the mechanism that depoliticizes prioritization: the loudest voice in the room stops winning by default.
Quick estimation techniques keep this from turning into a spreadsheet marathon:
- T-shirt size effort (S/M/L/XL) instead of exact hours, then convert to a 1 to 5 scale afterward.
- Evidence notes, a one-line citation next to every confidence score (“3 support tickets,” “A/B test from Q2,” “competitor does this”), so scores are auditable later.
- Time-box the whole scoring pass to 20 minutes for a backlog of 15 items. If it’s taking longer, your list is too granular.
Pro Tip: Lean teams (under five people) should simplify the formula to just Revenue Proximity × Confidence and skip reach and effort scoring entirely. Re-prioritize weekly. Larger teams with more moving parts can afford the fuller model and a biweekly cadence, since the extra precision is worth the extra time. This guidance comes straight from Spike’s framework for lean team scoring, and it’s the single biggest time-saver for teams that try to run RICE like an enterprise and burn a full day scoring a backlog that should have taken twenty minutes.
How Do You Run a 60 to 90 Minute Prioritization Workshop?
You don’t need an offsite or a consultant to sequence your next quarter of fixes. You need a room, a whiteboard, and the right pre-work done before anyone sits down.
Pre-work (do this before the meeting):
- Pull your top 10 to 15 candidate initiatives from tickets, stakeholder requests, and audit findings.
- Gather current funnel metrics: traffic, conversion rate by stage, CPA by channel, and email or ad engagement rates.
- Get rough effort estimates from whoever would build each fix (design, dev, or a freelancer).
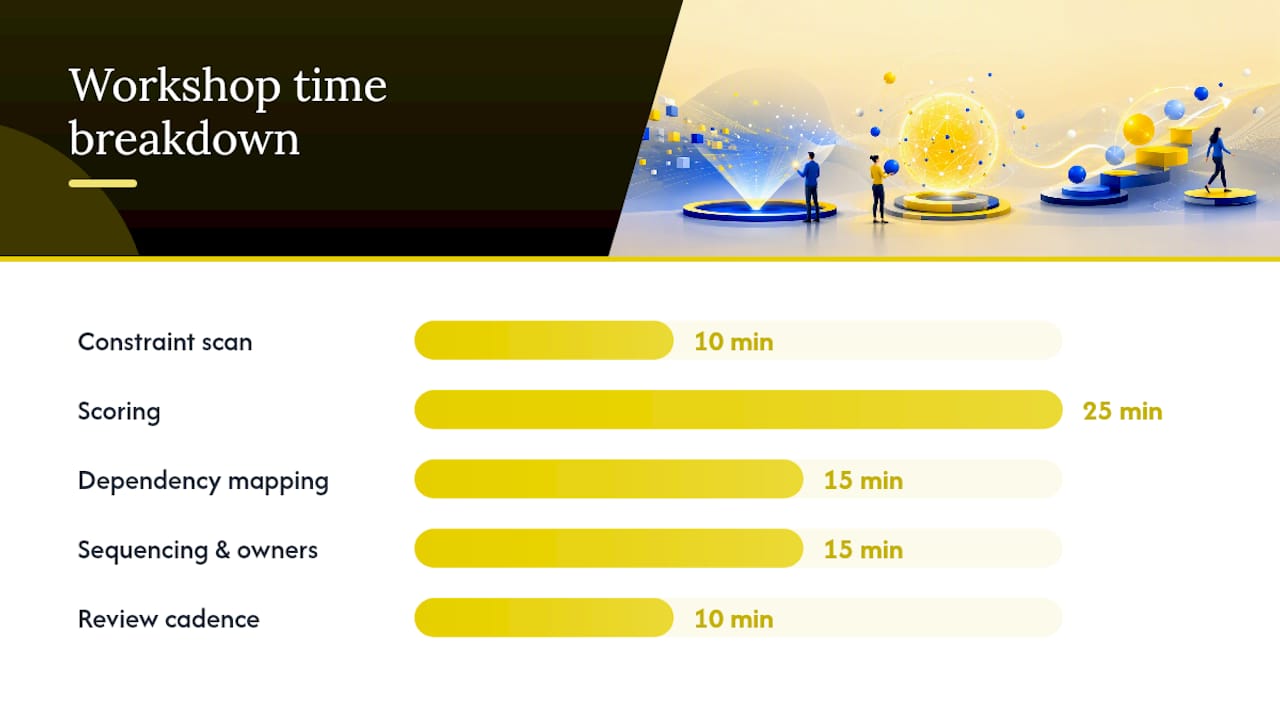
During the session, walk through five steps in order:
- Constraint scan (10 minutes). Look at the funnel stage by stage and find where the biggest percentage drop happens relative to benchmark. That’s your binding constraint. Everything upstream of it is wasted spend until it’s fixed.
- Scoring (25 minutes). Score every initiative against the constraint using your chosen formula. Initiatives that don’t touch the constraint at all get deprioritized automatically, no matter how good they sound.
- Dependency mapping (15 minutes). Draw arrows between initiatives. If fixing tracking has to happen before you can trust any conversion data, tracking goes first regardless of its raw score.
- Sequencing and owners (15 minutes). Assign the top three initiatives a named owner and a start date. Anything beyond three stays in the backlog. This is where the WIP limit gets enforced.
- Review cadence (10 minutes). Set the next check-in. Weekly for lean teams, biweekly for larger ones, matching the cadence guidance from Spike’s scoring model.
Before anyone leaves the room, lock down three things:
- An experiment window for each initiative (paid test duration, email test duration, landing page test duration).
- A pause or scale threshold written down in advance, not decided emotionally mid campaign.
- A one-line hypothesis for each initiative (“If we simplify the CTA, conversion rate increases because the current one buries the offer below the fold”) logged in a shared doc.
That hypothesis backlog is not busywork. HubSpot’s optimization research treats a documented backlog, testing calendar, and promotion process for winners as the minimum governance needed to stop teams from re-running the same failed experiment two quarters later. A workshop like Gleanit’s RICE scoring session example shows how this plays out with a real backlog, start to finish, in under 90 minutes.
What Fixes Should You Make First When a Campaign Breaks?
Run the triage in this order, because fixing step four before step one wastes every dollar spent afterward.
- Verify tracking and attribution. If your pixel is misfiring or UTM parameters are inconsistent, every other number in this list is unreliable. Fix this before touching creative or targeting.
- Check landing page conversion. A page converting well below account average is usually the binding constraint, not the ad.
- Audit creative fit. Does the creative match the audience’s stage of awareness, or is it selling a feature nobody asked about yet?
- Confirm offer clarity. Vague offers (“learn more”) underperform specific ones (“get your free audit in 48 hours”) almost every time.
- Review audience targeting. Check for overlapping segments cannibalizing each other’s delivery, and exclude converters from prospecting campaigns.
Practical pause and scale thresholds, drawn from HubSpot’s test-and-learn guidance:
- Pause a campaign once it hits 2 to 3 times target CPA with no sign of recovery over the following few days.
- Run paid A/B tests 1 to 2 weeks minimum before calling a winner, long enough for most audiences to reach a reliable signal.
- Email tests can show early direction in 24 to 48 hours, since open and click behavior surfaces fast.
- For bigger budget decisions, don’t rely on last-click data alone. Layer in incrementality testing to confirm a channel is generating real lift and not just claiming credit for conversions that would have happened anyway.
The highest-ROI experiments are usually the boring ones: a headline swap on the landing page, rotating in three new creative variants against a fatigued control, or excluding existing customers from a cold prospecting list. None of these require a developer sprint. All three routinely outperform a full campaign rebuild, because they attack the constraint directly instead of adding more volume on top of a broken step.
How Gleanit Turns This Workshop Into a Repeatable System
The constraint scan described above takes ten minutes on a whiteboard. It takes less time when the funnel data across Meta, TikTok, Google, and LinkedIn already lives in one connected view instead of six open tabs and a stakeholder’s memory of last month’s numbers. That’s the gap automated monitoring closes: it flags the funnel stage where performance is actually breaking down before your team spends a meeting arguing about where to look.
Prioritized recommendations work the same way the confidence-weighted formula does. A tool that surfaces gaps ranked by likely ROI is doing the scoring step for you, which shortens the distance between “we found a problem” and “we assigned an owner and a start date.” That’s the whole point of the workshop: less time debating, more time executing against a sequence someone actually wrote down.
AI-generated reporting closes the loop on governance. A documented hypothesis backlog only works if someone maintains it, and that maintenance is usually the first thing that slips when a team gets busy. Automating the write-up doesn’t replace judgment. It removes the excuse for skipping the paperwork that makes next quarter’s prioritization faster than this quarter’s.
How Does Marketing Prioritization Connect to Business KPIs?
A prioritization framework that ignores company-level KPIs just produces a well-organized list of the wrong work. Before scoring anything, map each candidate initiative to the specific business metric it’s supposed to move: revenue, customer acquisition cost, retention, or pipeline velocity. An initiative that scores high on the formula but doesn’t touch this quarter’s stated business goal should still lose to one that scores slightly lower but hits the target metric directly.
This is where the single-primary-goal rule from Backlinko’s marketing strategy research does double duty. Choosing one primary goal for 6 to 12 months doesn’t just focus the marketing team, it forces alignment with whatever the business is actually optimizing for that year, whether that’s new logo growth or expansion revenue from existing accounts.
Practically, this means your scoring session needs a KPI column, not just a score column. Before the workshop, write the current baseline and target for the primary metric on the whiteboard. Every initiative gets evaluated against whether it plausibly moves that number, not against how interesting it sounds. Marketing leaders who skip this step end up defending a roadmap to a CFO using marketing-specific metrics (engagement, impressions) that don’t translate into the language finance actually tracks. Tie every fix back to revenue proximity, and that conversation gets a lot shorter.
How Should Customer Feedback Shape What You Fix First?
Customer feedback is evidence, and evidence is the input that raises a confidence score from a guess to something defensible. Support tickets, sales call notes, churn survey responses, and on-site session recordings all feed directly into the confidence multiplier in the scoring formula covered earlier. An initiative backed by fifteen support tickets complaining about the same checkout step should outscore an initiative backed by a single executive’s hunch, even if the hunch sounds more exciting in a meeting.
The practical habit is tagging feedback sources next to each backlog item during the pre-work stage. If three separate data sources point to the same friction point, that’s a strong signal the constraint scan should confirm. If only one anecdotal comment supports an idea, it stays in the backlog until more evidence shows up, rather than jumping the queue because someone senior mentioned it twice.
Quantitative data insights matter just as much as qualitative feedback. Funnel drop-off rates, heatmap data, and email engagement trends often reveal problems customers never bother to report because they simply leave instead of complaining. Treat customer feedback and behavioral data as two separate evidence streams feeding the same confidence score, and weight direct behavioral data slightly higher, since what people do consistently outperforms what people say as a predictor of what will actually move conversion.
What Tools Help You Manage and Visualize Prioritization?
A spreadsheet works for the first workshop. It stops working once you’re tracking twenty initiatives across three channels and trying to remember which owner committed to which start date. At minimum, whatever system you use needs three things: a place to log scores and evidence notes, a way to visualize sequencing and dependencies, and a shared view everyone on the team can see without asking for an update.
Project management tools like Airtable or Trello handle the scoring and sequencing layer reasonably well for small teams, since both support custom fields for RICE-style scores and simple kanban views for tracking initiative status. The limitation shows up on the data side: neither one pulls funnel or ad performance automatically, which means someone has to manually update the numbers that feed the scoring formula every week.
That manual update is exactly where a unified dashboard earns its keep, since automated monitoring across ad platforms removes the lag between “something broke” and “someone noticed.” For creative-specific tracking, a structured testing framework keeps experiment results organized so the confidence score on your next creative fix is based on documented outcomes, not memory. Whatever stack you choose, the non-negotiable is a single source of truth for scores and evidence. Splitting that across four tools is how teams end up re-litigating decisions they already made three weeks earlier.
What Do Successful Prioritization Sequences Actually Look Like?
The pattern that shows up across teams that get this right is almost always the same: fix the leak before you turn up the tap. A team that discovers its landing page converts at half the account average doesn’t launch a new campaign to test messaging. It fixes the page first, then reruns the same campaign that was already “underperforming,” and the numbers move without a single new dollar of ad spend.
Attribution fixes follow a similar shape. A team running budget across four channels with broken UTM tracking has no reliable way to know which channel actually deserves more spend. Fixing tracking first, even though it produces no visible “win” on its own, is what makes every subsequent budget decision trustworthy instead of a coin flip. That’s the leverage argument behind the LICE framework: some fixes don’t move a metric directly, they make every other fix measurable.
Sequencing discipline also shows up in what teams choose not to do. Shopify’s guidance on marketing plans notes that a living plan should document what to stop doing as clearly as what to start, since abandoned initiatives that never get formally closed keep consuming attention and budget long after they’ve stopped producing results. Closing the loop on a failed test is as much a prioritization decision as launching a new one.
The Overlooked Part of Prioritization: Saying No on Purpose
Most prioritization advice focuses on how to rank what’s already on the list. The bigger lever is deciding what never makes the list at all. A backlog with forty items scored perfectly is still a backlog nobody will finish. The teams that actually compound results cap active initiatives at one to three and treat everything else as deliberately parked, not forgotten.
Conventional planning culture treats a long roadmap as a sign of ambition. In practice, it’s usually a sign nobody has identified the real constraint. If you genuinely know what’s blocking growth, the list of fixes worth doing right now gets short fast. When the list stays long, that’s usually evidence the constraint scan wasn’t honest enough, not evidence the business has more opportunities than most.
What the research actually supports is uncomfortable for teams that like the feeling of staying busy: fewer initiatives, run in the right order, beat more initiatives run in parallel almost every time. Start there. Run the constraint scan this week, score what’s left with real evidence attached, and resist the pull to add a fourth priority to a list that should have three.
— Ovannes
Turn This Workshop Into Action With Gleanit’s Free Audits
Running the constraint scan and scoring workshop above is a lot faster when the pre-work is already done for you. Gleanit’s free marketing audit maps your funnel and flags the gap most likely to be your binding constraint, before you even open a spreadsheet.
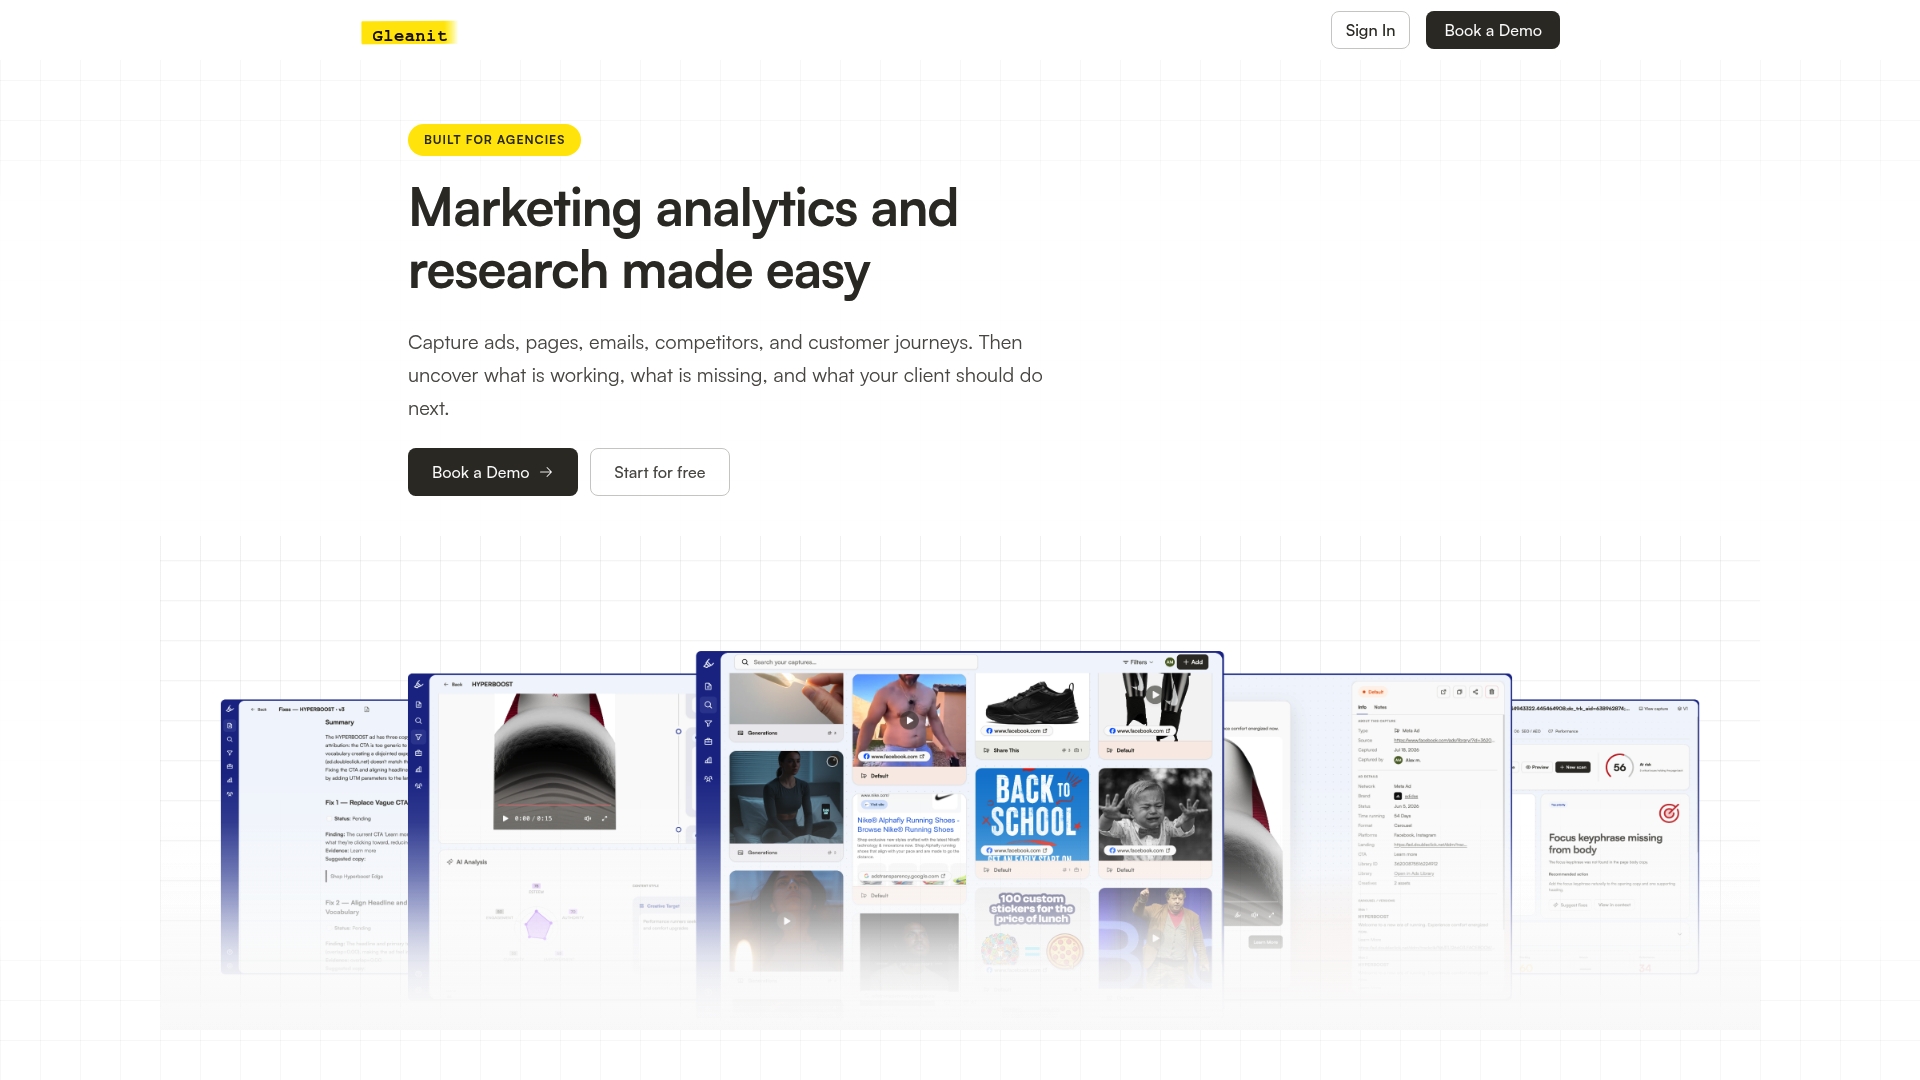
If tactical triage points to a specific channel, Gleanit has an audit for that too. The free ad audit checks creative fit and targeting across your active campaigns, and the free landing page audit catches the conversion leaks that make every dollar of upstream traffic worth less than it should be. Both are built for the exact triage checklist covered earlier, so you can walk straight from diagnosis into scored, sequenced fixes.
Once your team has run the workshop and knows which three initiatives come first, Gleanit’s Agency plan gives you automated monitoring across Meta, TikTok, and Google plus AI-generated reporting, so the review cadence you set in the workshop actually happens on schedule instead of slipping. Start with a free audit this week and see what your constraint scan turns up.
Sources
- Digital marketing optimization: 10 best strategies to increase marketing ROI
- 7 Steps to Build a Marketing Strategy That Actually Works in 2026
- The Marketing Prioritization Framework That Replaces Gut Feel With Compounding Wins | Spike
FAQ
What Is the 3-3-3 Rule in Marketing?
The 3-3-3 rule generally refers to giving a campaign or channel three months of consistent effort with three core tactics before judging results, rather than switching strategy every few weeks. It’s less a formal framework than a discipline reminder: most marketing fixes need a defined test window, similar to the 1 to 2 week minimum HubSpot recommends for paid A/B tests, before you can trust the data enough to act on it.
What Are Marketing Priorities?
Marketing priorities are the ranked list of initiatives a team commits to working on now, based on their expected impact on a single primary business goal. The strongest priority lists use a scoring model like RICE or a confidence-weighted formula, Revenue Proximity × Reach × Confidence divided by Effort, rather than relying on whoever argues loudest in a planning meeting.
What Is the 40-40-20 Rule in Marketing?
The 40-40-20 rule holds that campaign success depends 40% on audience targeting, 40% on the offer, and 20% on creative execution. It’s a useful mental model for triage: if a campaign underperforms, check targeting and offer clarity before blaming the ad copy, since those two factors carry most of the weight.
How Often Should You Re-Prioritize Marketing Fixes?
Lean teams should re-prioritize weekly, and larger teams with more complex scoring can run a biweekly cadence, following the team-size guidance from Spike’s prioritization model. Either way, treat the roadmap as a living document you revisit on a fixed schedule, not something you set once per quarter and forget.
How Much Does Gleanit Cost?
Gleanit’s Solo plan runs $99 per month, and the Agency plan is $459 per month, with additional users and workspaces priced separately. Free tools, including the marketing audit, ad audit, and landing page audit, are available at no cost before you commit to a plan.
Recommended
- Rank Marketing Campaigns with RICE: 60–90 Minute Workshop + Example
- 45 Minute LinkedIn Ads Competitor Audit for Agencies
- Campaign Post Mortem: A Repeatable Agency Template
- Monitor Meta Ads in 10 Minutes: 2026 Automation First Workflow for Agencies
Corrections: ovannes@hearye.co or our editorial policy.