
RICE is a numeric prioritization formula, Reach multiplied by Impact multiplied by Confidence, divided by Effort, that marketing and growth teams use whenever reach and effort can actually be measured. It works best for ranking campaigns, experiments, and feature requests against each other with real numbers instead of gut feel. Below you’ll find a worked marketing example, scoring heuristics for each variable, and a workshop template you can run this week.
TL;DR:
- RICE scoring relies heavily on accurate, real-time data for reach, impact, and confidence, which can be compromised if analytics are weak or outdated.
- Small errors in the Confidence or Reach variables can significantly skew the final score, making close rankings less reliable.
- When analytics are limited, starting with simpler models like ICE may be more effective before switching to RICE as data quality improves.
- Automated data collection tools like Gleanit can provide real campaign metrics, reducing guesswork and enhancing the reliability of RICE scores.
- Productivity drops if teams compare raw reach across vastly different client bases without adjusting for revenue or strategic importance.
Table of Contents
- What Is RICE Scoring in Marketing?
- How Do You Calculate RICE for a Marketing Idea?
- How Should You Score Each RICE Variable?
- Where Does RICE Scoring Go Wrong?
- When Should You Use ICE, PIE, or WSJF Instead?
- How Do You Run a RICE Scoring Workshop?
- What I’ve Seen Work With RICE in Practice
- Score Faster With Real Campaign Data, Not Guesswork
- Sources
What Is RICE Scoring in Marketing?
RICE started as an internal prioritization tool at Intercom, built to help product teams stop arguing about which feature to build next and start scoring it. Marketing teams adopted it for the same reason: too many campaign ideas, not enough hours, and no shared math to settle the debate.
The formula is simple:
RICE Score = (Reach × Impact × Confidence) ÷ Effort
Each variable has a canonical scale that keeps scoring consistent across a team:
- Reach: the number of people or accounts affected in a given time window (leads per month, users per quarter).
- Impact: how much the initiative moves the needle, scored on a scale of 0.25 (minimal) to 3 (massive), per ProductPlan’s glossary.
- Confidence: your certainty in the other three numbers, expressed as a percentage.
- Effort: total person-months required across every role involved.
Divide the product of the first three by the fourth, and you get a single number you can rank against every other idea on the list.
How Do You Calculate RICE for a Marketing Idea?
Say your team is choosing between two campaign ideas for next quarter: a retargeting push on Meta and a revamped email nurture sequence. Both compete for the same design and copy resources, so you need one number that accounts for reach, payoff, certainty, and cost.
- Pick your units. Reach in leads per month, Effort in person-months, per the practical mapping approach most growth teams use for campaign scoring.
- Score the retargeting campaign. Reach: 1,200 leads/month. Impact: 2 (strong historical lift from retargeting). Confidence: 80% (you have prior campaign data). Effort: 1.5 person-months.
- Score the email sequence. Reach: 3,000 leads/month. Impact: 1 (moderate, since nurture sequences convert slowly). Confidence: 60% (new copy, untested subject lines). Effort: 2 person-months.
RICE snapshot: Retargeting scores (1,200 × 2 × 0.8) ÷ 1.5 = about 1,280. Email scores (3,000 × 1 × 0.6) ÷ 2 = about 900.
Retargeting wins on paper, even with a smaller reach, because Impact and Confidence carry more weight than raw volume. But push Confidence on the email sequence up to 75% (maybe you find a similar sequence from a past campaign), and its score jumps to 1,125, close enough to call a statistical tie.
How Should You Score Each RICE Variable?
Scoring consistency lives or dies on how disciplined you are with each input, not on the formula itself.
- Reach: Pull from analytics, not intuition. Google Analytics, your CRM, or ad platform dashboards should supply a real count for a fixed window (monthly or quarterly). Practitioner guidance recommends locking one window and using it for every idea in the same scoring round, so you’re never comparing a monthly number against a quarterly one.
- Impact: Anchor to a proxy metric, conversion lift, retention change, or average order value shift, then map that proxy to the 0.25 to 3 scale. A campaign with a proven double-digit lift from prior A/B tests earns a 2 or 3; a speculative brand play earns a 0.5.
- Confidence: Base the percentage on actual evidence. Past test results justify 80% or higher. A hunch with no data backing it should sit closer to 40% to 50%, which is also your cue to run a short discovery spike before committing resources.
- Effort: Add up person-months across every role, design, copy, engineering, paid media, and round to the nearest half-month for anything under three months.
Pro Tip: Keep a running spreadsheet of past campaign Impact and Confidence scores next to their actual results. After two or three quarters, you’ll have your own internal benchmark instead of guessing every time.
If your analytics setup is thin, tightening basic tracking and measurement before your next scoring round pays off fast, since RICE is only as good as the numbers feeding it.
Where Does RICE Scoring Go Wrong?
RICE multiplies three estimates together, which means a small error in one input doesn’t just add noise, it compounds. A Confidence score that’s off by 10 percentage points can swing the final result enough to reorder your whole roadmap, which is exactly why treating close scores as ties matters more than chasing decimal-point precision.
A few other traps to watch for:
- Foundational work always loses. Tech debt, tracking fixes, and compliance work rarely score well because they lack a clean Reach or Impact number, even though skipping them creates bigger problems later. Score these on a separate lane, not against acquisition campaigns.
- Raw Reach isn’t comparable across client bases. A 5,000 person Reach for a small client’s email list means something completely different than 5,000 for an enterprise account. When you’re scoring across clients or portfolios, swap Reach for revenue or strategic value instead of raw headcount.
- Confidence under 50% is a signal, not a score. If your evidence is that thin, run a small test or discovery sprint before you commit a RICE number to the backlog.
When Should You Use ICE, PIE, or WSJF Instead?
RICE isn’t always the right tool. If you’re triaging a long list of rough ideas and don’t have solid reach data yet, ICE (Impact, Confidence, Ease) gets you a fast ranking without demanding a Reach number you don’t have.
- ICE: best for early-stage brainstorms or when Reach is either unknown or roughly the same across every idea.
- PIE (Potential, Importance, Ease): built for page-level conversion optimization, where Importance (how critical the page is to revenue) matters more than raw traffic.
- WSJF (Weighted Shortest Job First): fits time-sensitive work where the cost of delay outweighs everything else, useful for larger teams juggling dependencies.
Smaller teams with limited data maturity tend to do better starting with ICE and graduating to RICE once analytics infrastructure catches up.
How Do You Run a RICE Scoring Workshop?
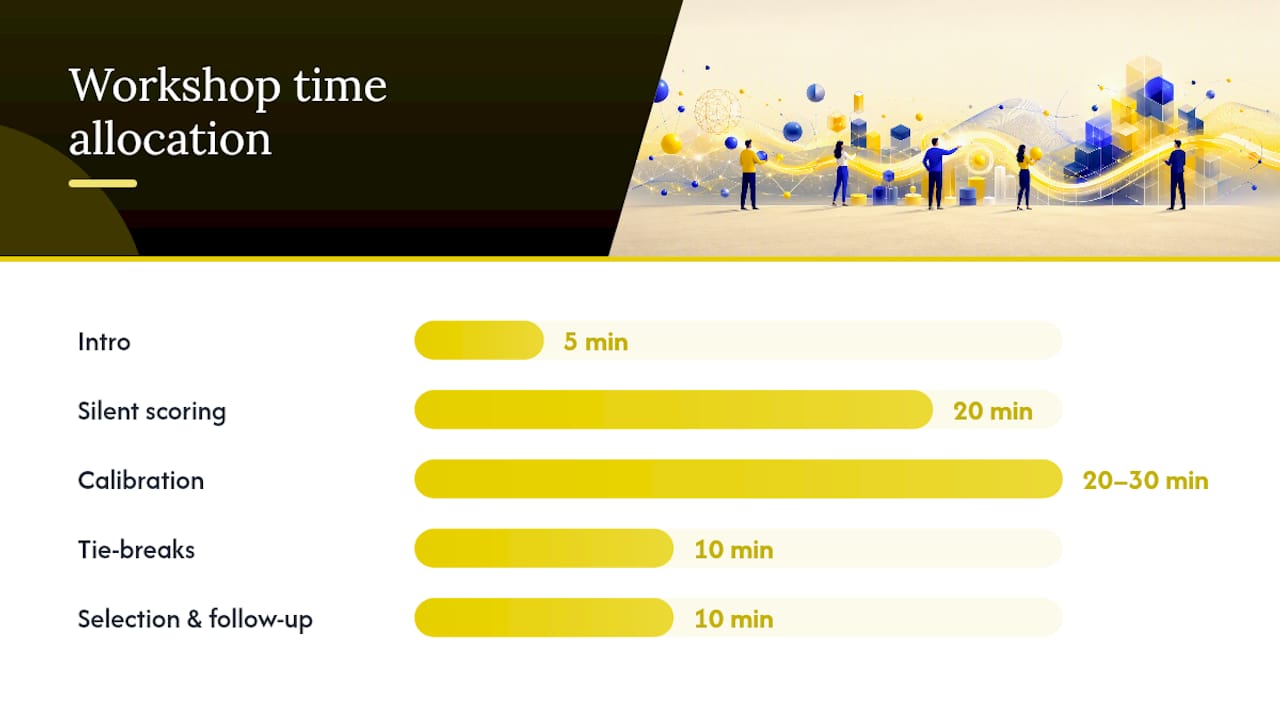
A focused 60 to 90 minute session, run quarterly, is enough to score a full backlog and walk away with a ranked list everyone trusts.
Prework (do this before the meeting):
- Export analytics for the reach window you’re using (last 30 or 90 days).
- Compile the full candidate list of campaigns or experiments.
- Agree on units in advance, leads per month, person-months for Effort, so nobody debates definitions live.
Workshop agenda:
- Intro (5 minutes): restate the reach window and scales everyone will use.
- Silent scoring (20 minutes): each person scores every idea independently, no discussion, to avoid anchoring bias.
- Calibration (20 to 30 minutes): compare scores out loud, resolve big gaps, especially in Confidence and Impact.
- Tie-breaks (10 minutes): for any scores within 15% of each other, decide by strategic fit or team bandwidth rather than the number alone.
- Selection and follow-up (10 minutes): lock the top three to five initiatives, assign owners, and set a measurement window.
Assign one facilitator to run the clock and one data verifier to check Reach and Effort against actual analytics exports, not memory. Re-score the backlog every quarter, or sooner if a campaign’s real results diverge sharply from its original Confidence estimate.
What I’ve Seen Work With RICE in Practice
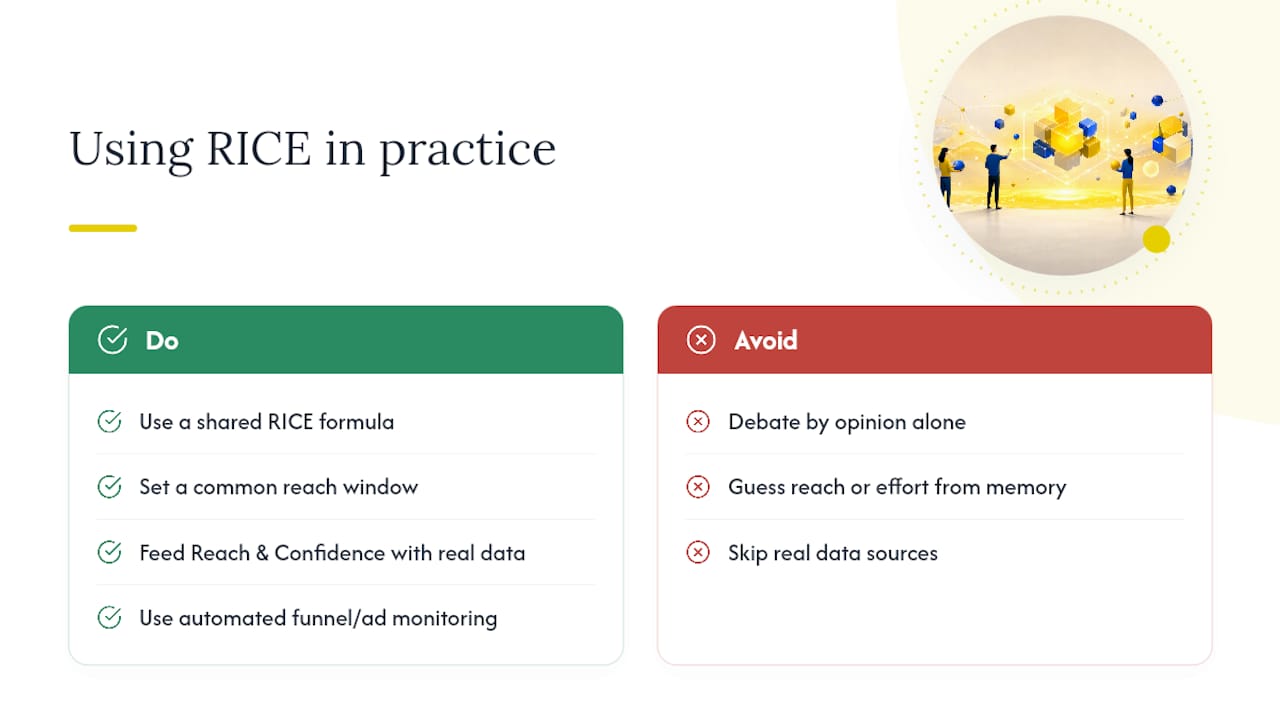
RICE earns its keep by ending the meeting where everyone argues about their favorite idea for forty minutes and nothing gets decided. Give a team a shared formula and a shared reach window, and the debate shifts from opinion to evidence, faster.
The catch is that RICE is only as good as the inputs behind it, and most teams don’t have clean reach and effort data sitting in one place. That’s where automated funnel and ad monitoring tools like Gleanit earn their place, not by replacing judgment, but by feeding the Reach and Confidence numbers with real campaign data instead of guesses pulled from memory.
— Ovannes
Score Faster With Real Campaign Data, Not Guesswork
Some platforms give agencies and growth teams reach and confidence numbers RICE actually needs, without hours spent pulling reports from five different ad platforms.
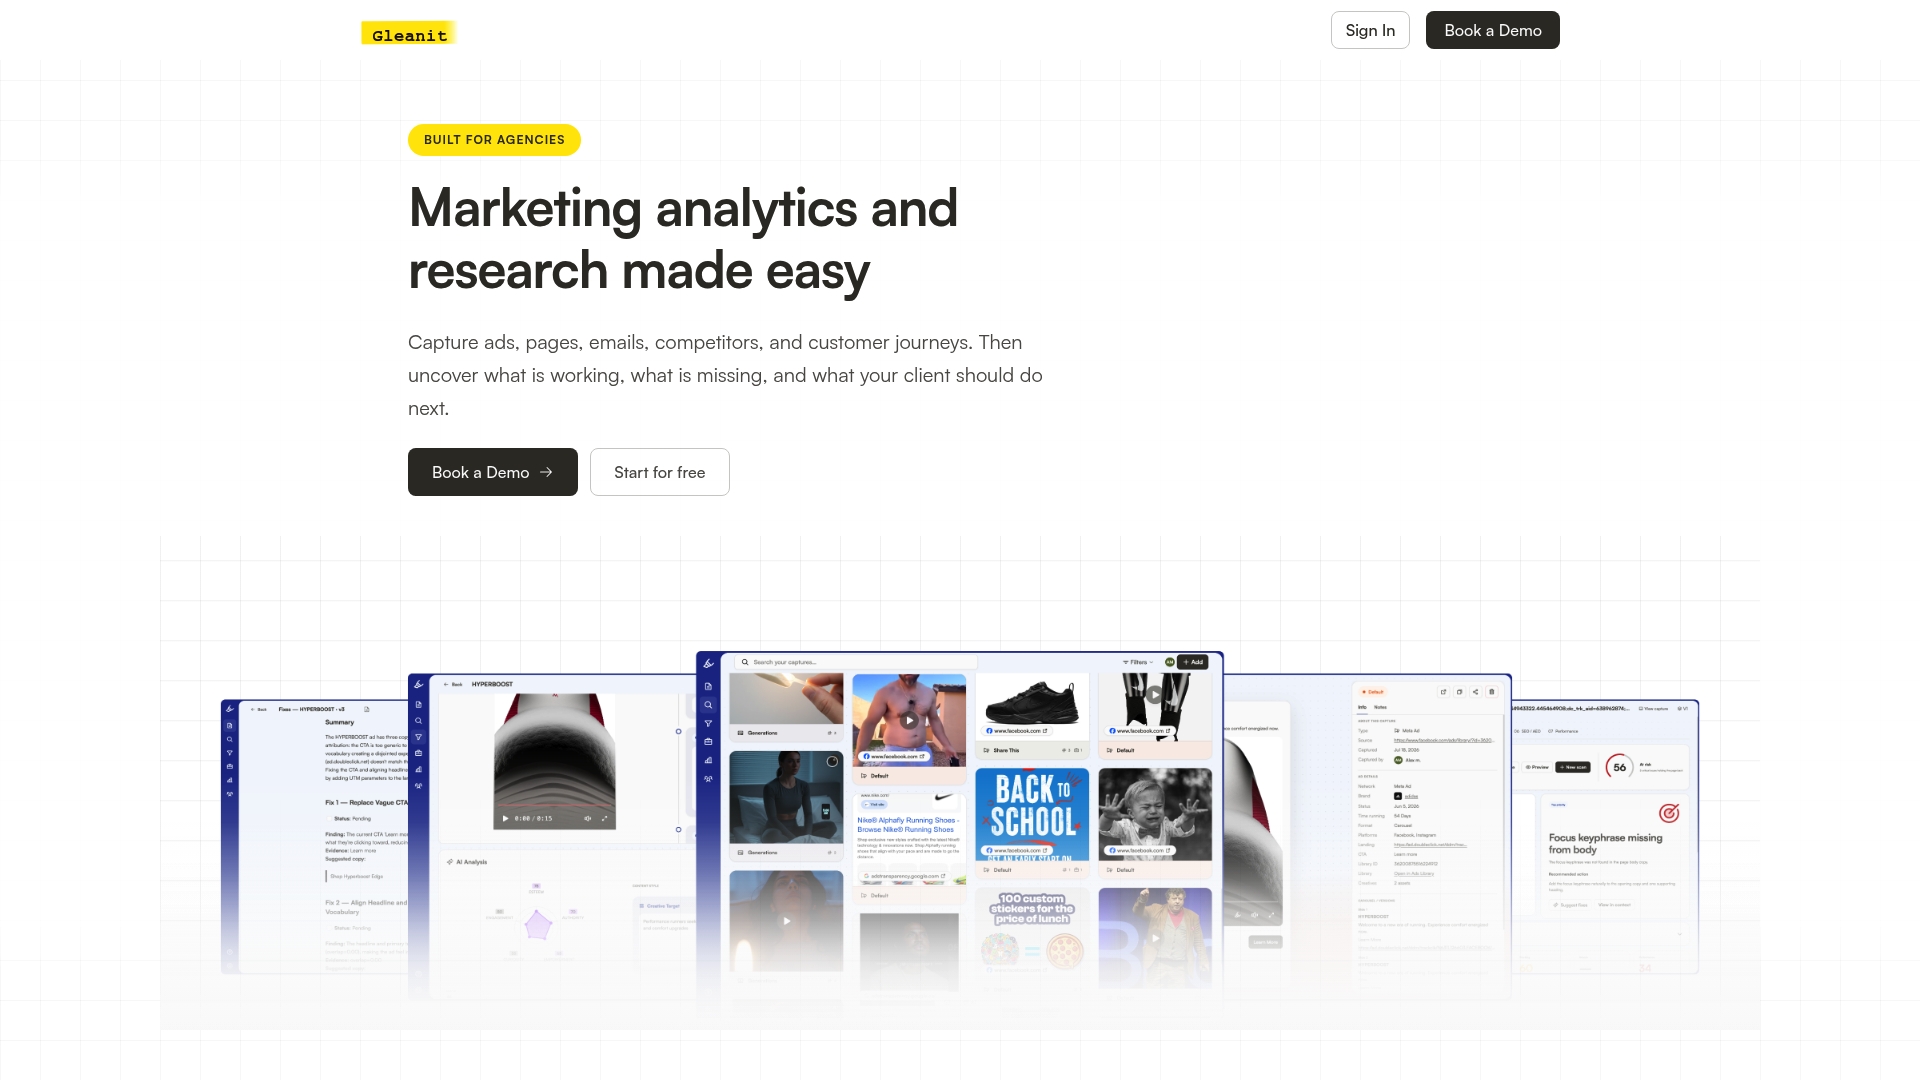
Instead of estimating Reach from memory or last quarter’s rough numbers, automated monitoring across platforms can track real customer journeys and flag funnel gaps as they happen. That means the Reach and Impact figures going into your next scoring round come from live campaign data, not a spreadsheet someone half remembers filling out in March. Some platforms provide funnel diagnostics that surface where a campaign is underperforming, which can help turn a vague Confidence guess into a number backed by evidence. Combined with frequent feature updates and AI-generated reporting, such tools can support teams running RICE scoring rounds regularly and needing fresh inputs each time. Start a trial on the Gleanit platform and pull your next scoring round’s numbers straight from real data.
Sources
Recommended
- Campaign Post Mortem: A Repeatable Agency Template
- Google Ads Competitor Research: A Practical Workflow for Marketers
- Monitor Google Ads: A Practical Checklist for Marketers
- A Creative Testing Framework That Actually Scales Ad Results
Corrections: ovannes@hearye.co or our editorial policy.