
US TikTok ads benchmarks for 2026 show that median CPM varies by objective: $4.10 for Reach, $6.80 for Traffic, $12.40 for App Installs, and $16.20 for Conversions, based on aggregated campaign data from multiple advertisers. A median CPC of $0.62, a median in-feed CTR between 0.61% and 1.77%, and a median CPA for DTC ecommerce near $15.80 for first-time purchasers, according to an aggregated dataset of 3,127 campaigns across 548 advertisers. ROAS medians generally range above 2x for conversion-objective campaigns, with top-quartile accounts pushing well above that, according to available industry data. These are the numbers your account should be measured against before you touch a single bid or creative.
If your CPC is above $1.04 (the 75th percentile), your creative is the first thing to audit. If your CTR is below 0.61%, your hook is failing in the first two seconds. If your CPA is above $33, you may be targeting too broadly or your post-click experience might be leaking conversions.
Three immediate actions based on where you land:
- Above median CPA: Test Spark Ads. The same dataset shows Spark Ads deliver roughly 1.92× higher CTR and approximately 28% lower CPA than standard in-feed on median, which is the single biggest lever most accounts are not using.
- Below median CTR: Rotate creative. TikTok’s algorithm deprioritizes ads with declining engagement signals fast, often within 48–72 hours of launch.
- Below P25 ROAS: Audit your attribution window. A mismatch between TikTok’s default 7-day click window and your actual purchase cycle inflates CPA and deflates reported ROAS.
Spark Ads deliver roughly 1.92× higher CTR and ~28% lower CPA than standard in-feed on median — the single most actionable format switch available to most US advertisers right now.
Key Takeaways
The single most important action for any US TikTok advertiser in 2026 is to compare performance against vertical-specific P25–P75 bands, not platform-wide averages, and to test Spark Ads if that format represents less than 30% of current in-feed spend.
| Point | Details |
|---|---|
| Median CPC is $0.62 | TikTok remains one of the cheapest social clicks; IQR runs $0.38–$1.04 across objectives. |
| Spark Ads outperform in-feed | Spark Ads deliver roughly 1.92× higher CTR and ~28% lower CPA than standard in-feed on median. |
| Industry context is mandatory | Finance median CPA ($41.30) vs. Beauty ($14.20) — never benchmark across verticals. |
| CPM rises with objective | Median CPM ranges from $4.10 (Reach) to $16.20 (Conversions); match your benchmark to your objective. |
| Gleanit automates the monitoring | Gleanit tracks live TikTok metrics, flags P25–P75 deviations, and generates prioritized recommendations automatically. |
Table of Contents
- What are the core TikTok ads benchmarks for US campaigns?
- How do TikTok ad benchmarks differ by industry?
- How do different TikTok ad formats perform?
- How do you use benchmarks to audit and optimize TikTok campaigns?
- What trends are shaping TikTok ad performance in 2026?
- How were these benchmarks compiled?
- How Gleanit helps you track TikTok benchmarks in real time
- An agency perspective on using TikTok benchmarks
- Gleanit makes TikTok benchmark monitoring automatic
- Sources
What are the core TikTok ads benchmarks for US campaigns?
The table below covers the eight metrics that matter most for US TikTok advertisers, with median values and the 25th–75th percentile band, based on compiled benchmark data. Cross-publisher summaries show published medians vary by dataset and methodology, so the ranges here reflect that honest spread rather than false precision.
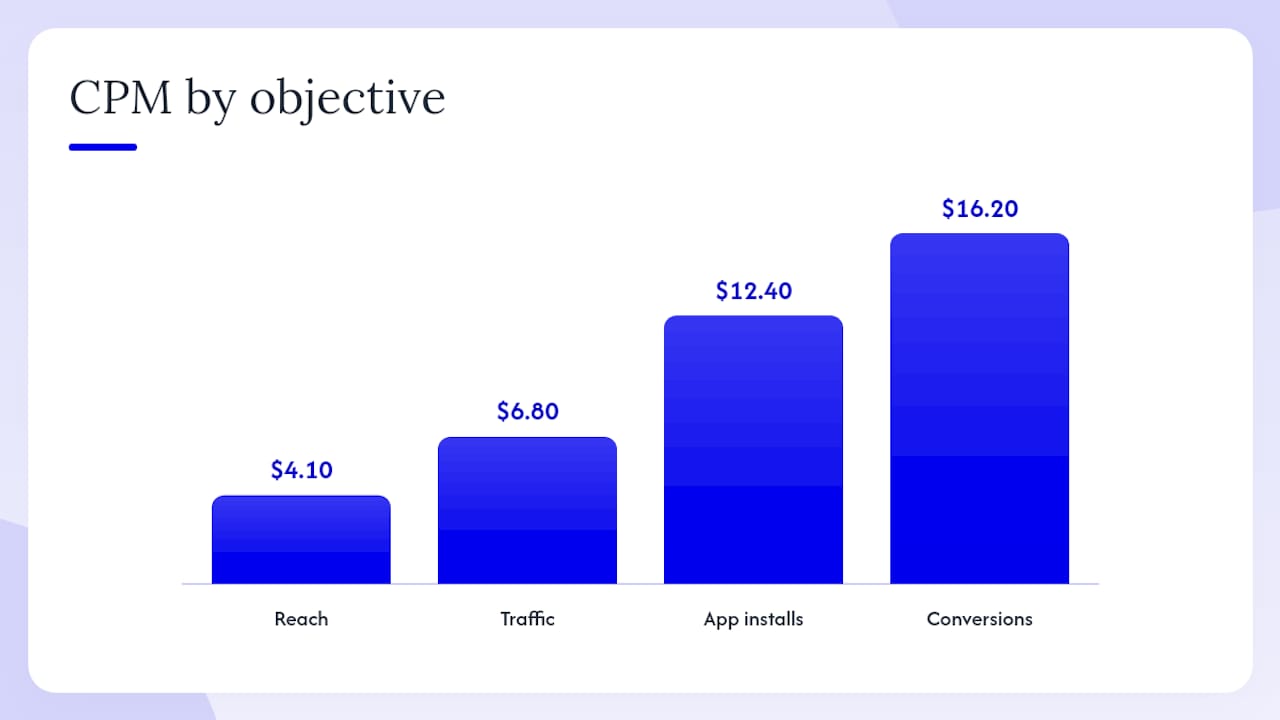
CPM varies sharply by objective. AdLiftr’s dataset puts median CPM at $4.10 for Reach campaigns, $6.80 for Traffic, $12.40 for App Installs, and $16.20 for Conversions. | CPC | $0.38 | $0.62 | $1.04 | Total spend ÷ link clicks | | CTR | 0.61% | — | 1.77% | Link clicks ÷ impressions | | CVR | — | — | — | Conversions ÷ link clicks | | CPA | — | $15.80 | — | Total spend ÷ conversions | | ROAS | — | — | — | Revenue attributed ÷ ad spend | | AOV | — | $68 | — | Revenue ÷ number of orders | | MER | — | — | — | Total revenue ÷ total ad spend (blended) |
A few definitions worth pinning down. CVR here is post-click: it measures what percentage of people who clicked your ad completed the target conversion event, not the percentage of people who saw the ad. CPA uses TikTok’s default 7-day click, 1-day view attribution window unless otherwise noted. MER (Marketing Efficiency Ratio) is a blended, account-level metric that does not isolate TikTok, which is why it runs lower than ROAS.
CPM varies sharply by objective. AdLiftr’s dataset puts median CPM at $4.10 for Reach campaigns, $6.80 for Traffic, $12.40 for App Installs, and $16.20 for Conversions. Running a Conversions campaign and comparing your CPM to a Reach benchmark is a common mistake that makes your account look worse than it is.
Pro Tip: Use the median as a diagnostic threshold, not a target. If your metric sits in the P25–P75 band, you are competitive. If it falls below P25 on ROAS or above P75 on CPA, that is where you prioritize. The mean is almost always skewed by a handful of high-spend outliers, so a single average number tells you less than the percentile band does.
How do TikTok ad benchmarks differ by industry?
Industry is the biggest single driver of CPA and ROAS variance on TikTok. A Finance advertiser running lead-gen will never hit the same CPA as an Apparel brand running a catalog sale, and comparing them directly is how agencies lose client trust. TikAdSuite’s industry breakdown shows the spread is wide enough that vertical-specific bands are the only meaningful reference point.
Beauty performs best on CTR and ROAS because the format fits the platform natively. Tutorial content, before-and-after clips, and creator-led demos are exactly what TikTok users scroll for. The purchase cycle is short, the AOV is manageable, and the creative brief practically writes itself.
Electronics struggles on CTR and CVR for the opposite reason. High-consideration purchases need more than a 15-second clip to convert. Advertisers in this vertical tend to see better results using TikTok for upper-funnel awareness and retargeting via other channels for close.
Finance carries the highest CPM on the platform, driven by compliance constraints that limit creative formats and the competitive bidding among lenders, insurance brands, and fintech apps. The CPA figure here reflects lead-gen events (form fills, app installs), not revenue conversions, so ROAS is not a meaningful metric for most Finance advertisers.
Pets is an underrated vertical. Low CPM, strong CTR, and a loyal audience that over-indexes on TikTok relative to other platforms make it one of the more efficient categories for DTC brands.
The biggest diagnostic mistake is benchmarking a Finance lead-gen campaign against a Beauty ecommerce CPA. Industry context is not optional — it is the frame that makes every other number meaningful.
When your numbers fall outside the P25–P75 band for your vertical, run through these questions before changing bids:
- Is your creative format native to TikTok (vertical, sound-on, fast hook) or repurposed from another channel?
- Does your landing page load in under 3 seconds on mobile?
- Are you targeting a cold audience or a warm one, and does your CPA benchmark reflect that split?
- Is your attribution window aligned with your actual purchase cycle length?
- Have you excluded existing customers from your acquisition campaigns?
- Is your campaign objective set to the correct event (Purchase vs. Add to Cart vs. View Content)?
Pro Tip: If your vertical’s median CPA looks high but your AOV is also high, the ratio is what matters. A $41 CPA on a $200 product is a 20.5% acquisition cost. A $14 CPA on a $22 product is 63.6%. Always sanity-check CPA against AOV before deciding whether a number is good or bad.
How do different TikTok ad formats perform?
Format choice moves the needle more than most advertisers expect. The same creative in a Spark Ads wrapper versus a standard in-feed placement can produce meaningfully different results, and TopView operates in a different performance category entirely.
TopView CPM is typically a negotiated reservation buy rather than an auction metric, so CPC and CPA comparisons to in-feed formats are not directly equivalent. Its CTR is high because it owns the first full-screen moment when a user opens the app, but that reach comes at a premium that only makes sense for brand campaigns with large budgets.
Spark Ads consistently outperform standard in-feed on both CTR and CPA because they run from a creator’s or brand’s organic post, which carries social proof signals (likes, comments, shares) that a dark ad does not. The algorithm also appears to treat Spark Ads more favorably in delivery, likely because the underlying content has already demonstrated organic engagement.
Catalog and Collection Ads work best for retargeting users who have already visited a product page. The CPM is lower than Spark Ads because the audience is narrower, and the CPA reflects the warmer intent of that audience.
A few format-specific decisions worth making deliberately:
-
Use Spark Ads for cold acquisition when you have creator content with proven organic engagement (at least 1,000 organic views before boosting).
-
Use standard in-feed for A/B testing creative concepts before committing budget to a Spark Ads authorization.
-
Use Catalog Ads for retargeting product viewers within a 14–30-day window.
-
Reserve TopView for product launches or seasonal moments where brand reach justifies the CPM premium.
Pro Tip: For Spark Ads, keep the clip under 21 seconds for acquisition objectives. Longer content works for awareness but tends to see drop-off before the CTA appears, which tanks CVR. The sweet spot for cold-audience Spark Ads is 9–15 seconds with the hook in the first 2 seconds and the offer visible by second 6.
How do you use benchmarks to audit and optimize TikTok campaigns?
Benchmarks are only useful if they connect to a specific action. Here is a practical sequence for turning a benchmark gap into a test.
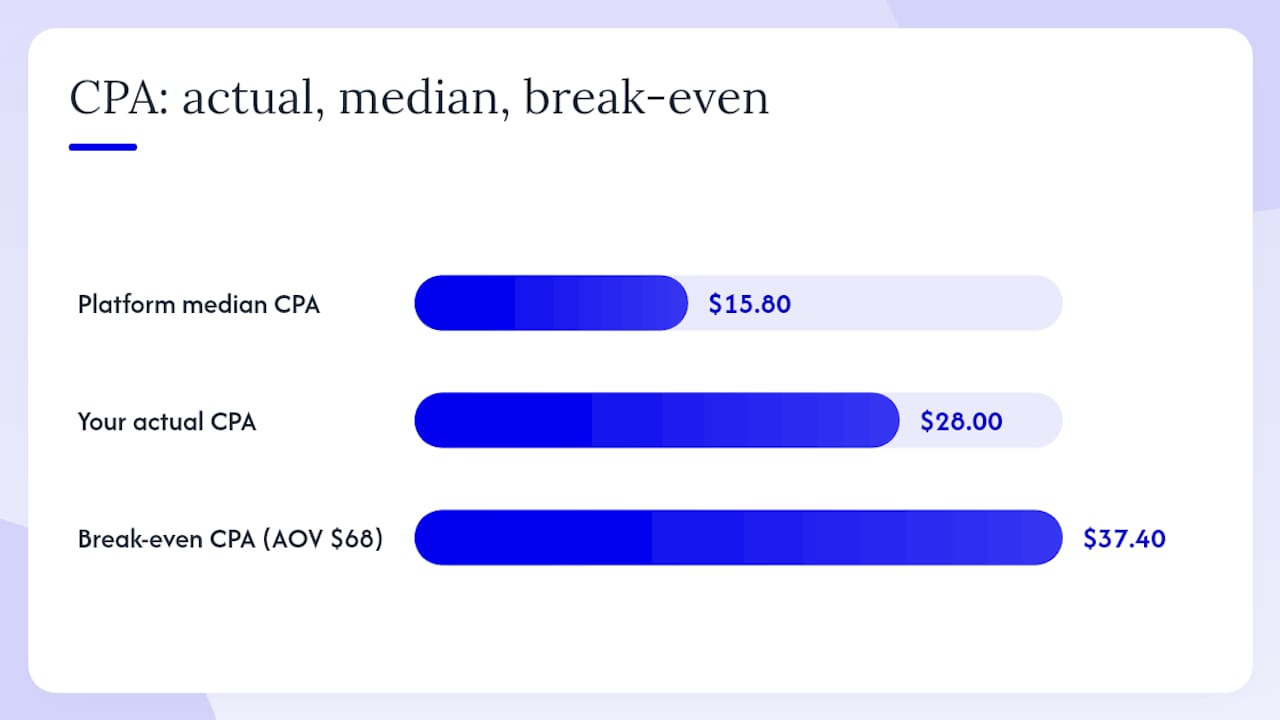
1. Calculate your target CPA from AOV and margin. Start with your gross margin percentage. If your AOV is $68 (the platform median) and your gross margin is 55%, your maximum allowable CPA to break even is $37.40 ($68 × 0.55). The platform median CPA of $15.80 for DTC ecommerce leaves you a healthy margin buffer. If your actual CPA is $28, you are still profitable but operating at roughly 59% of your margin ceiling. That is the number to bring down, not a crisis to react to.
2. Map your deviation to the right lever.
- CPA above P75 + CTR below median: creative is the problem. The ad is not stopping the scroll.
- CPA above P75 + CTR at or above median: post-click is the problem. The landing page is losing people.
- CPM above P75 + CTR above median: you are paying for reach but converting it. Consider whether the CPM premium is justified by ROAS.
- CVR below P25: check your attribution window first, then your landing page load time, then your offer clarity.
3. Prioritize tests by deviation magnitude. The account metric furthest from its P25–P75 band is the first test. Do not run five simultaneous tests. One variable, one week, minimum $50/day to exit the learning phase.
4. Check your Spark Ads allocation. If Spark Ads are below 30% of your in-feed spend and your CPA is above median, reallocating budget is the lowest-effort, highest-probability improvement available. Multiple industry sources converge on Spark Ads as the format with the most consistent CPA improvement for DTC advertisers.
5. Audit attribution before drawing conclusions. TikTok’s default 7-day click, 1-day view window overstates performance for long purchase cycles and understates it for impulse categories. If your product has a 14-day consideration window, your reported CPA will look worse than it actually is.
The median CPC of $0.62 with an IQR of $0.38–$1.04 makes TikTok one of the cheapest mainstream social clicks available in 2026, but cheap clicks only matter if your post-click experience converts them.
Pro Tip: Set a minimum daily budget of $50 per ad set for at least 7 days before evaluating performance. TikTok’s algorithm needs roughly 50 conversion events to exit the learning phase. Below that threshold, your CPA data is noise, not signal, and optimizing against it will make things worse.
What trends are shaping TikTok ad performance in 2026?
Recent industry tracking shows a consistent directional pattern across reporting periods: CPMs are rising, CTR is improving, but CVR and ROAS have softened for many advertisers. That combination tells a specific story about where the platform is in its maturity cycle.
Key trend signals:
- CPM is up across most objectives as more advertisers enter the auction. The platform’s US user base continues to grow, but advertiser demand is growing faster, compressing margins on reach-based campaigns.
- CTR has improved, likely because creative quality has risen across the board. More advertisers are producing native-format content, which raises the baseline engagement rate.
- CVR has softened despite better CTR, suggesting the gap between TikTok engagement and purchase intent is widening. Users click more but convert less, which points to a post-click problem rather than a creative one.
- ROAS has declined for many conversion-objective campaigns, partly from CPM inflation and partly from attribution changes that have reduced the credit TikTok claims for assisted conversions.
The CPM-up, CVR-down pattern is the defining tension for TikTok advertisers in 2026. Paying more for reach while converting a smaller share of clicks means the efficiency gains have to come from post-click optimization, not just creative.
For 2026 planning, the implication is clear: top-of-funnel TikTok spend is getting more expensive, so the brands that win are the ones investing in landing page optimization, offer clarity, and post-click retention. Doubling your creative budget while leaving a slow-loading mobile page untouched is the wrong order of operations.
Pro Tip: If your ROAS has declined year-over-year but your CTR has held steady, run a cohort analysis on your landing page conversion rate by traffic source. A TikTok-specific landing page that mirrors the creative’s tone and offer tends to recover 15–25% of lost CVR without touching bids.
How were these benchmarks compiled?
Timeframe and sample. The primary dataset covers February through May 2026, drawn from 3,127 campaigns across 548 advertisers, as reported by AdLiftr. Cross-publisher ranges incorporate additional benchmark reports published in 2025–2026 from TikAdSuite, Benchmarketing, and Influee.
US-only filtering. All figures in this article apply to US-targeted campaigns unless explicitly noted. CPM, CPC, and CPA vary significantly by geography. European and Southeast Asian benchmarks run materially lower on CPM and CPA, so mixing them into a US benchmark would understate your actual competitive baseline.
Metric definitions. CVR is post-click (conversions ÷ link clicks). CPA uses TikTok’s default 7-day click, 1-day view attribution window. ROAS reflects TikTok-attributed revenue only, not blended MER. AOV is order-level, not session-level.
Attribution window caveat. Any benchmark dataset built on TikTok’s native attribution will reflect TikTok’s own measurement logic, which tends to credit more conversions than third-party tools like Northbeam or Triple Whale. If you use a multi-touch attribution model, your reported CPA will likely be higher and ROAS lower than these medians suggest.
Key caveats before applying these numbers:
- Small advertisers (under $5,000/month spend) show higher CPA variance than the medians suggest. A single campaign with an unusual audience or creative can move your account average by 40–60%.
- Industry mix within a dataset affects every published median. A dataset heavy on Beauty and Apparel will show lower CPAs than one heavy on Finance and Travel.
- Campaign objective changes mid-flight reset the learning phase and distort period-over-period CPA comparisons.
- Benchmarketing recommends reading metrics across four bands (P25, median, P75, elite) rather than a single average, because advertiser spend and campaign mix skew means significantly.
These benchmarks reflect a specific sample, timeframe, and attribution methodology. They are a directional reference, not a guarantee. Your industry, AOV, creative quality, and landing page all shift where your account should realistically land.
Update cadence. TikTok’s auction dynamics shift quarterly. These figures will be reviewed and updated as new dataset releases become available.
How Gleanit helps you track TikTok benchmarks in real time
Knowing the benchmarks is one thing. Knowing the moment your account drifts outside them is another. Gleanit monitors your TikTok Ads alongside Meta and Google in a single connected view, so you see CPM, CPC, CTR, CVR, and CPA trends as they move, not after the fact in a weekly report.
The platform flags funnel gaps automatically and surfaces prioritized recommendations based on where your metrics deviate from industry norms. Instead of manually comparing your CPA to a published table every week, you get an alert when your CPA crosses a threshold you set, with a suggested fix attached.
Key capabilities relevant to benchmark monitoring:
- Live CPM, CPC, CTR, and CPA tracking across TikTok, Meta, and Google with industry median overlays
- Automated alert rules that trigger when a metric exits your target P25–P75 band
- Funnel gap diagnostics that identify whether a CPA problem is creative, post-click, or audience-driven
- AI-powered report generation that translates raw benchmark data into client-ready summaries
- Client-dedicated workspaces so each account’s benchmarks stay isolated and comparable over time
The agencies that move fastest on benchmark deviations are the ones with monitoring in place before the gap widens. A CPA that drifts 20% above median over two weeks costs far more to recover than one caught in the first 48 hours.
Pro Tip: Set your Gleanit alert thresholds at P75 for CPA and P25 for CTR. Those are the two metrics that move first when a campaign starts degrading, and catching them early gives you a full learning cycle to course-correct before spend compounds the problem.
An agency perspective on using TikTok benchmarks
The mistake most agencies make with benchmarks is treating them as client-facing targets rather than internal diagnostic tools. A client does not need to know that the platform median CPA is $15.80. They need to know whether their $22 CPA is good or bad given their AOV, margin, and vertical, and what you are doing about it.
At the portfolio level, benchmarks are most useful for spotting which accounts are underperforming relative to their vertical peers, not for setting uniform targets across clients. A Beauty brand and a Finance brand on the same agency roster should never be measured against the same CPA number.
The reporting cadence that works: weekly internal benchmark checks against P25–P75 bands, monthly client-facing performance reviews that contextualize numbers against vertical medians, and quarterly strategic reviews that incorporate YoY trend data. Clients who understand that their $19 CPA sits in the top quartile for Health & Wellness are far easier to retain than clients who only see a number without context.
When a client’s metrics fall outside the P25–P75 band, fold it into a prioritized action item with a specific test attached. “Your CPA is above the 75th percentile for your vertical” is a diagnosis. “We are testing a Spark Ads allocation increase from 20% to 40% of in-feed spend this week, targeting a 15% CPA reduction based on format-level benchmarks” is a plan.
Pro Tip: Build a benchmark band into every client SLA. Define “healthy” as P25–P75 for their vertical, “at risk” as above P75 on CPA or below P25 on ROAS, and “critical” as two consecutive weeks outside that band. It removes subjectivity from performance conversations and gives you a clear escalation trigger.
Gleanit makes TikTok benchmark monitoring automatic
Most agencies spend hours each week pulling numbers that should surface themselves. Gleanit cuts that work by connecting your TikTok Ads account alongside Meta and Google, then alerting you the moment a metric drifts outside the benchmark band you set.
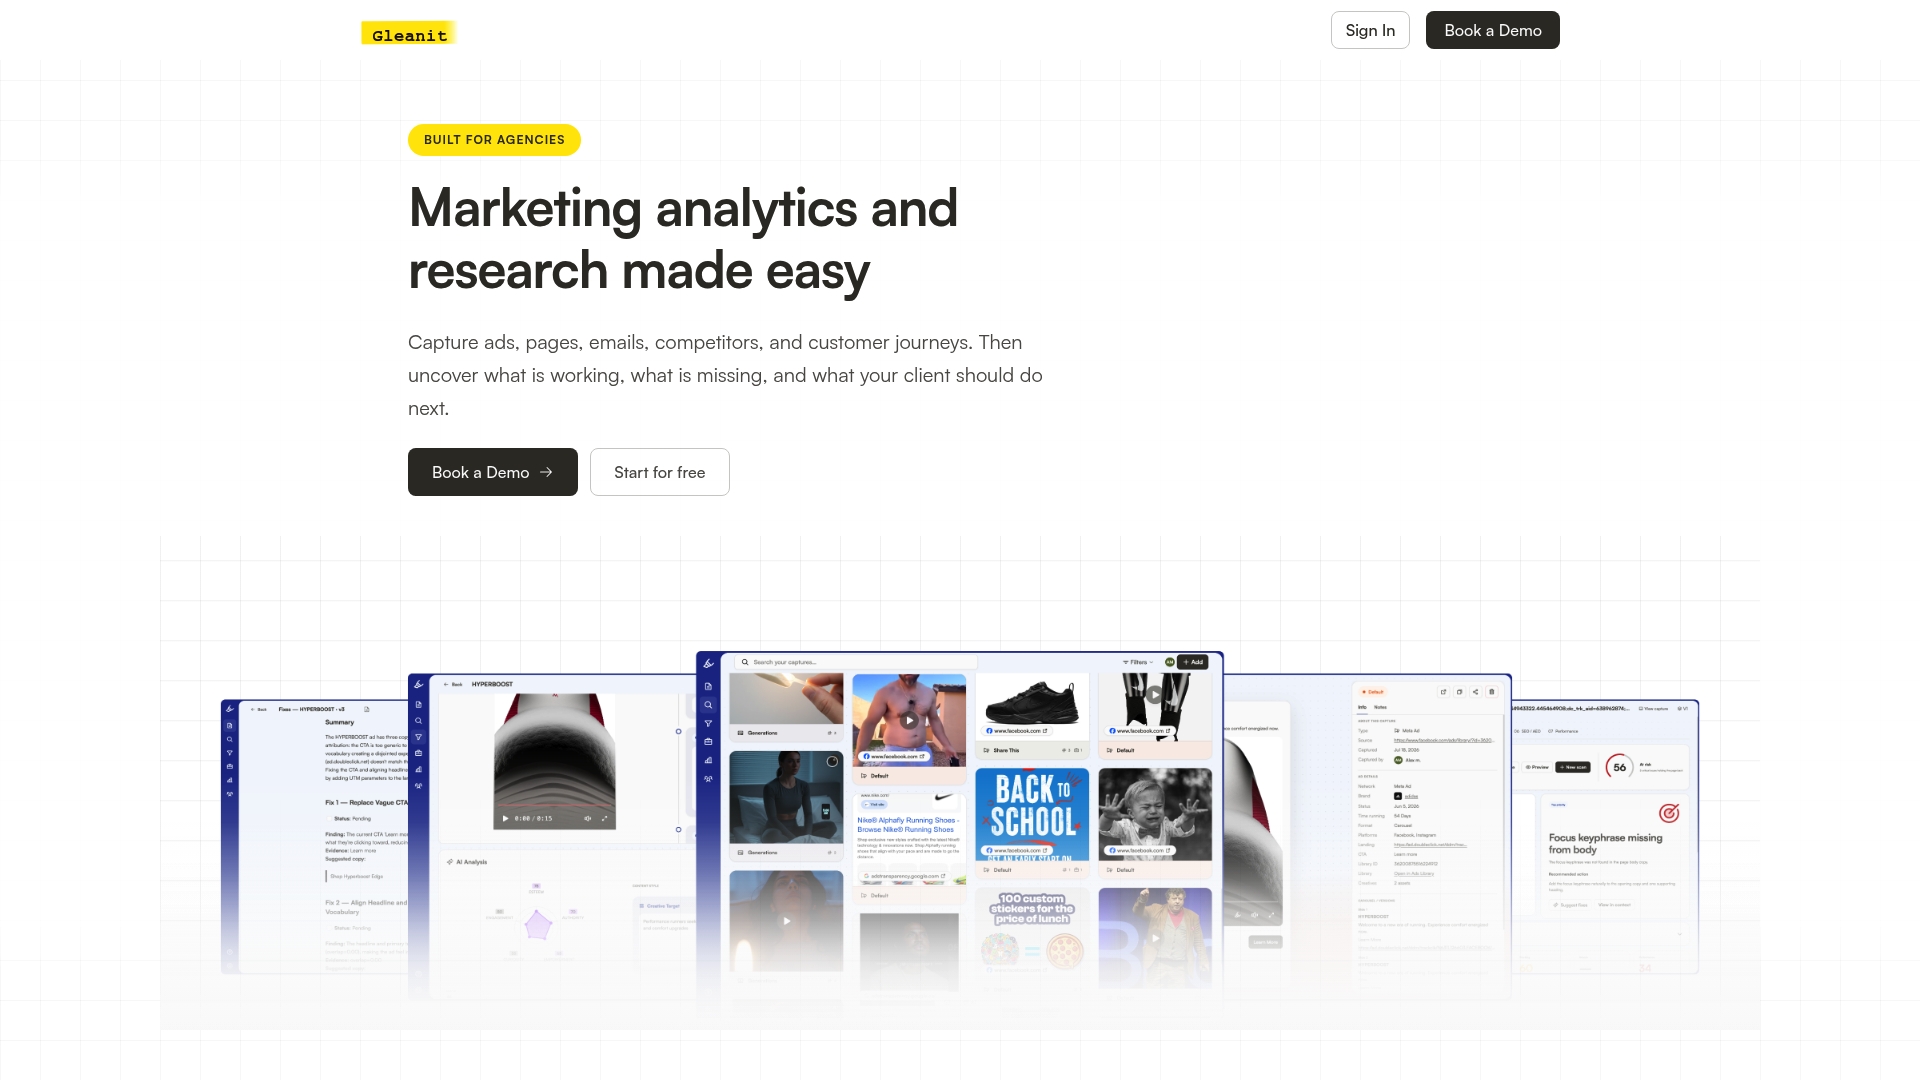
You get automated funnel diagnostics that tell you whether a CPA spike is a creative problem, a landing page problem, or an audience problem, without manually cross-referencing three dashboards. The AI-powered reporting layer turns those diagnostics into client-ready summaries in minutes. Each client gets a dedicated workspace, so benchmark tracking stays clean across your entire portfolio.
Agencies using Gleanit stop reacting to performance problems after they compound and start catching them in the first 48 hours. Third-party validation on G2 confirms that real-time monitoring and prioritized recommendations are the features marketing teams value most in analytics platforms.
Visit Gleanit to start a free trial and set your first TikTok benchmark alert today.
Sources
The following sources contributed data and analysis to this article:
- TikTok Ads Cost 2026: CPM, CPC, CPA Benchmarks | AdLiftr
- TikTok Ads Benchmarks by Industry: Full 2026 Report - TikAdSuite
- Tiktok Ads Benchmarks 2026 | Benchmarketing
- G2
Recommended
Article generated by BabyLoveGrowth
Corrections: ovannes@hearye.co or our editorial policy.