
Track A/B tests with one canonical tracker that records experiment metadata, hypotheses, and experiment IDs, paired with a short monitoring checklist and a pre-registered analysis plan. Open a tracker template, fill in the required fields before launch, and run the same validation steps (sample ratio mismatch, data completeness, guardrails) every time results come in. That combination is what separates a program that scales from one that just runs a lot of tests.
TL;DR:
- Using a single, well-structured tracker with predefined fields ensures clear documentation of hypotheses, metrics, and experiment details, which prevents redefinition of success and enhances reliability.
- Tracking experiment IDs, start/end dates, and exposure splits across tools creates a seamless data flow and minimizes errors from manual handling or duplicate tests.
- Regular monitoring of traffic splits, sample ratio mismatches, and tag consistency during a test helps detect upstream errors early, avoiding invalid results and wasted effort.
- Validating data completeness and applying statistical checks like SRM before analysis ensures trustworthy insights and reduces false positives in conclusion drawing.
- Archiving comprehensive experiment artifacts, including reports and screenshots, supports future learning, prevents redundant testing, and improves long-term experimentation discipline.
Table of Contents
- Why You Need a Tracker to Track A/B Tests Properly
- The Parts of a Tracker: Exact Fields to Record
- Wiring Your Tracker Into Tools and Dashboards
- The Monitoring Checklist While a Test Is Live
- Analyzing Results and Writing the Report
- Archiving Tests So Learnings Outlive the Team
- Practice Example: Wiring a Tracker Into a Unified Dashboard
- Key Docs and Guides to Bookmark
- A Quick Take on What Actually Breaks Experimentation Programs
- Sources
- FAQ
Why You Need a Tracker to Track A/B Tests Properly
A spreadsheet full of test names is not a tracker. A real tracker is the single source of truth that tells anyone in the company what’s running, why, and what “done” looks like.
Most experimentation programs don’t fail because the statistics are wrong. They fail because nobody wrote down the hypothesis before the test launched, so the team quietly redefines success once the data looks favorable. A tracker with a pre-registered plan closes that door. It forces you to commit to a primary metric and a decision threshold before you see a single result, which is the single best defense against data fishing that experimentation guides consistently flag.
Beyond discipline, a tracker delivers practical, day-to-day wins:
- Cross-team visibility: Product, marketing, and engineering can see what’s live without a Slack thread every Monday.
- No duplicate tests: Two teams testing the same checkout button in different tools wastes traffic and confuses attribution.
- Faster onboarding: A new analyst can read six months of tracker rows and understand what’s already been tried, instead of re-learning it the hard way.
- Institutional memory: Implementation notes and screenshots saved with each row mean nobody has to reverse-engineer what a variant actually looked like a year later.
None of this requires a fancy platform. It requires a habit, enforced by a template that makes skipping fields harder than filling them in.
The Parts of a Tracker: Exact Fields to Record
A tracker is only as useful as its schema. Too few fields and you can’t reconstruct what happened; too many and nobody fills it out. Here’s a minimal set that works for most teams running website, product, or ad experiments.
- Test name and experiment ID — a short, consistent identifier (see naming conventions below).
- Hypothesis — one sentence: “If we do X, then Y will change because Z.”
- Primary metric and its exact definition — conversion rate defined how, over what window, counted how.
- Baseline value and minimum detectable effect (MDE) — with the sample size that MDE requires.
- Start and end dates — planned and actual, since they often differ.
- Owner — a name, not a team.
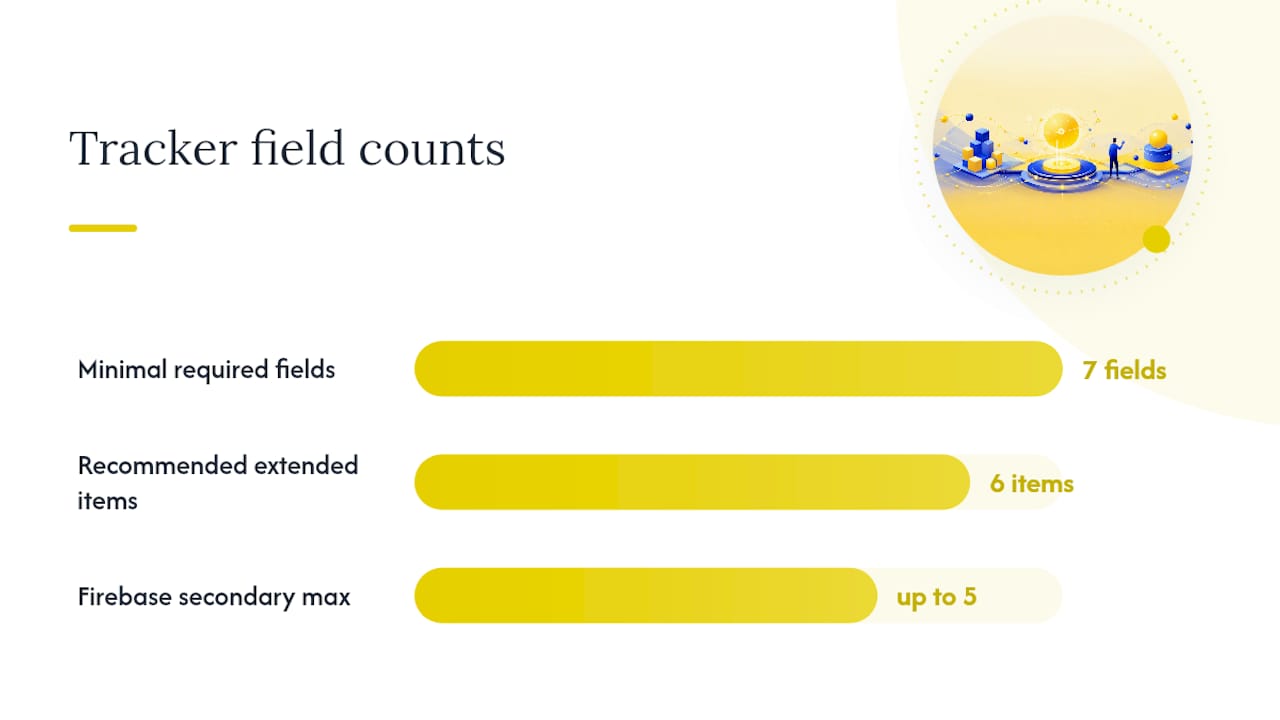
- Variant IDs and exposure percentage — how traffic is split and among which segments.
Once those seven are locked in, add a recommended extended layer: guardrail metrics that must not regress, a segmentation plan agreed before launch, links to implementation tickets, QA sign-off status, screenshots of each variant, and a link to the live dashboard. Firebase’s Remote Config documentation recommends defining the primary metric and exposure percentage explicitly and tracking up to five secondary metrics alongside it, which maps almost exactly onto this schema.
Pro Tip: Build experiment IDs from a fixed pattern like YYYYMM-team-shortname (for example, 202603-growth-checkout-cta). It sounds trivial, but it’s the single detail that makes joining tracker rows to analytics events painless six months from now.
Wiring Your Tracker Into Tools and Dashboards
You don’t need one mega-platform. You need a stack where each layer does one job, and the experiment ID travels cleanly between them.
Most experimentation stacks break into five categories: an experiment or feature-flag platform that runs the split, an analytics or warehouse layer that stores raw events, a tag manager that fires the exposure event, a BI or dashboard tool that visualizes results, and a lightweight registry (your tracker) that ties it all together. The connective tissue is the experiment ID: it needs to ride inside the event payload from the moment a user is bucketed, through your analytics pipeline, into whatever BI tool renders the dashboard. Firebase’s guidance on analytics exports is a good model here. It recommends piping experiment data into BigQuery so you can independently verify experiment membership rather than trusting a single console’s math.
A spreadsheet is genuinely fine when you’re running a handful of tests a month and checking results manually. You need automated dashboards once you’re running concurrent tests across multiple channels, because manual pulls turn into a full-time job. A scheduled freshness check, even a simple one that flags when a data export hasn’t updated in 24 hours, catches broken pipelines before they corrupt a week of results.
| Tool category | What it does | When you need it |
|---|---|---|
| Experiment/feature-flag platform | Runs the split, assigns variants | Any test beyond a manual URL split |
| Analytics/warehouse | Stores raw event-level data | Once you need independent verification |
| Tag manager | Fires exposure and conversion events | Whenever marketing owns instrumentation |
| BI/dashboard | Visualizes lift, CIs, and trends | Running 3+ concurrent tests |
| Lightweight registry (tracker) | Central record of what’s running and why | From test number one |
The Monitoring Checklist While a Test Is Live
Run this checklist on a fixed cadence, not just when something looks off. Regular checks during the early phase of a test, then less frequently, work well for most teams.
- Check the actual traffic split against the intended split. Google Cloud’s monitoring guidance treats a split within about 10% of the intended allocation as acceptable; anything beyond that needs investigation before you trust the numbers.
- Run a sample ratio mismatch (SRM) check. If your 50/50 test is landing at 54/46 with a large enough sample, that’s not noise. An SRM failure usually points to a bucketing bug or a redirect issue, and it invalidates the test until fixed.
- Verify experiment IDs and tags are present in your analytics export. A missing tag on 10% of sessions will quietly bias your results toward whichever variant happens to tag correctly.
- Scan for partial-day gaps, device skew, or channel-specific allocation problems. A test that looks fine in aggregate can be badly broken on iOS or in a single ad channel.
- Decide your peeking rule before you start, and stick to it. Either commit to a fixed sample size and don’t look early, or use a sequential method built for safe peeking, like always-valid p-values, so early checks don’t inflate your false-positive rate.
An SRM check that flags a real mismatch is one of the more reliable early-warning signals in experimentation. It rarely means your effect is fake. It almost always means something upstream, a redirect, a caching layer, a bot filter, is broken.
Analyzing Results and Writing the Report
Before you interpret a single number, validate the data. That means confirming data completeness (no missing days, no broken tags), passing the SRM check, hitting the pre-registered sample size, and, where feasible, letting the test run through full weekly cycles so day-of-week effects don’t skew the read. Atticus Li’s analysis framework walks through this validation sequence before any point estimate gets trusted, and skipping it is how teams end up shipping a “winning” variant that was really a data artifact.
Once the data checks out, evaluate the primary metric with three numbers together: the point estimate, its confidence interval, and whether the lift is large enough to matter practically, not just statistically. Report the lower bound of the confidence interval when you’re making a ship or no ship call. It’s the conservative read, and it protects you from overselling a result that got lucky. Check guardrail metrics next. A 3% lift in sign ups paired with a 15% jump in support tickets is not automatically a win.
Segmentation gets reported differently depending on when you decided to look. Pre-planned segments (mobile vs. desktop, new vs. returning) get reported with the same rigor as the primary metric. Exploratory segments you noticed after the fact get flagged as hypothesis-generating, not conclusive, and queued for a follow-up test.
A canonical report template keeps this consistent across a whole team:
- Summary: one paragraph, plain language, what happened and what you’re doing about it.
- Metrics table: primary and guardrail metrics with point estimates and confidence intervals.
- Decision: ship, iterate, or kill, with the reasoning in one line.
- Learnings: what surprised you, even if the test was a loss.
- Follow-ups: the next test this one suggests.
Pro Tip: Don’t close the loop at the ship decision. Monitor the actual production metric for two to four weeks after rollout and compare it to the lift your test predicted. Tracking that ratio over a dozen tests tells you how much to trust your own experimentation program going forward.
Archiving Tests So Learnings Outlive the Team
An experiment’s value doesn’t end when the report ships. Store the full artifact set, the tracker row, screenshots, tickets, and the final report, somewhere durable and link it back to the tracker so a search doesn’t require asking around.
Most monitoring consoles cap how long they retain raw data (some cut off at 180 days), which is exactly why warehouse exports matter for anything you might want to revisit a year later.
- Archive to a wiki or shared drive, and keep a warehouse copy of the underlying event data for deeper reanalysis later.
- Set a minimum retention period and require the report template’s five fields before a test is marked archived, not just closed.
- Tag learnings by theme (pricing, onboarding, checkout) so a quarterly audit can surface which categories deliver the highest ROI.
- Assign one owner for the canonical record. Sign off happens at report submission, not at launch.
Inconclusive tests belong in the archive too. A null result that’s documented well saves the next person from rerunning the same idea in six months.
Practice Example: Wiring a Tracker Into a Unified Dashboard
Picture an agency running five concurrent creative tests across Meta and TikTok for one client. Each test’s experiment ID flows from the ad platform into a unified dashboard, and the same dashboard surfaces where the funnel actually leaks, not just which ad won. That’s the workflow Gleanit is built around: automated monitoring across Meta, TikTok, and Google feeds one connected view, so a stalled funnel step and an underperforming variant show up in the same place instead of three different tabs.
Their approach centers on identifying gaps in marketing funnels and prioritizing high-impact fixes, with AI-assisted reporting that turns raw monitoring data into a report an account manager can hand to a client the same day.
That prioritization step is where a lot of trackers stall, which is why exploring AI tools for marketers can help automate reporting and speed decision-making. You know a test lost. Gleanit’s job is helping you decide what to test next, backed by creative testing frameworks and category benchmark data that give you a realistic bar for what counts as a meaningful lift.
Key Docs and Guides to Bookmark
Save these for implementation day: Google Cloud’s A/B monitoring documentation for traffic-split tolerances, Firebase’s Remote Config guide for exposure and metric setup, and Atticus Li’s analysis framework for the validation sequence. Pair those with Gleanit’s unified dashboard breakdown for how centralized monitoring shortens the loop from data to decision.
A Quick Take on What Actually Breaks Experimentation Programs
The programs that stall almost always share three habits: a primary metric defined loosely enough to argue about after the fact, an SRM check nobody ran until a stakeholder asked hard questions, and a tracker row with no named owner. Fix those this week. Add a naming rule, make five fields mandatory before a test can launch, and set one SRM alert. None of it costs money.
— Ovannes
Sources
- Monitor and analyze A/B experiments | AI Commerce Search in Gemini Enterprise for Customer Experience | Google Cloud Documentation
- A/B Testing with Firebase Remote Config | Firebase documentation
- How to Analyze A/B Test Results: Segmentation and Honest Interpretation
- mehranmoghadasi/ab-test-significance-toolkit
FAQ
How Long Should an A/B Test Run?
Run it until you hit your pre-registered sample size and it has covered at least one full weekly cycle, so day-of-week patterns don’t distort the result. Stopping early because a graph looks good, without an always-valid method built for peeking, inflates your false-positive rate.
How Do You Run an A/B Test From Start to Finish?
Write the hypothesis and primary metric, calculate the sample size for your minimum detectable effect, launch with the exposure percentage locked in, monitor traffic splits and SRM daily, then validate data completeness before analyzing the point estimate and confidence interval.
What Is the Best A/B Testing Tool?
There’s no single best option. It depends on your stack: teams need an experiment or feature-flag platform for splitting traffic, an analytics/warehouse layer like BigQuery for independent verification, and a tracker or registry to tie test metadata together across teams.
What Counts as a Good A/B Testing Success Rate?
There’s no universal benchmark, since it depends on your metric, traffic volume, and how ambitious the hypothesis is. What matters more than a hit rate is documenting every test, including losses, since inconclusive results still generate learnings worth feeding into your next prioritization round.
Recommended
- A Creative Testing Framework That Actually Scales Ad Results
- Monitor Google Ads: A Practical Checklist for Marketers
- Customer Journey Analytics: A Practical Guide for Marketing Teams
- Google Ads Transparency Guide for Marketers: Workflow & Tricks
Corrections: ovannes@hearye.co or our editorial policy.