
Track five things: conversion rate, micro-conversions (CTA clicks, form starts), traffic source, engagement signals (bounce rate, time on page), and load speed. Pull them from GA4’s Landing page report, Google Ads’ Landing pages report, and HubSpot’s Analyze tab. Right now, save one custom report in whichever tool you use most, and add a single event to track form submissions if you haven’t already. That’s the whole starting point.
TL;DR:
- Conversion rate significantly varies by industry, with top pages reaching double digits, but most pages perform below this depending on traffic quality.
- Micro-conversions such as CTA clicks and form starts provide early signals that can identify issues with forms or messaging before full conversions occur.
- Loading speed and mobile rendering improvements yield quick, impactful lifts in performance, making them the top priorities before testing new messaging.
- Tracking setup should include secondary dimensions in GA4, form event marking, and consent management to ensure data accuracy across all platforms.
- Combining traffic, engagement, and speed metrics into a single monitoring system reduces reporting conflicts and accelerates problem diagnosis.
Table of Contents
- Which Landing Page Metrics Actually Matter?
- How Do You Set Up Tracking in GA4, Google Ads, and HubSpot?
- Why Do Landing Page Reports Give Conflicting Numbers?
- What Should You Fix First After You Start Tracking?
- Why Unified Monitoring Changes How Fast You Can Diagnose Problems
- The Real Lesson in All This Tracking Advice
- See What Gleanit Catches in Your First Week
- Sources
- FAQ
Which Landing Page Metrics Actually Matter?
Conversion rate is the metric your budget answers to. Calculate it as conversions divided by total sessions on that page, multiplied by 100. If a landing page pulls 2,000 sessions and 60 conversions, that’s a 3% rate. Whether that’s good depends heavily on industry and offer type. According to Landingi’s KPI breakdown, top-performing pages can reach double-digit conversion rates, while most fall well below that depending on the vertical and traffic quality.
But conversion rate alone hides the story. Micro-conversions catch the earlier signals: CTA clicks, form starts, video plays, PDF downloads. A page with a weak overall conversion rate but strong CTA click-through usually has a form problem, not a messaging problem. That distinction changes what you fix first.
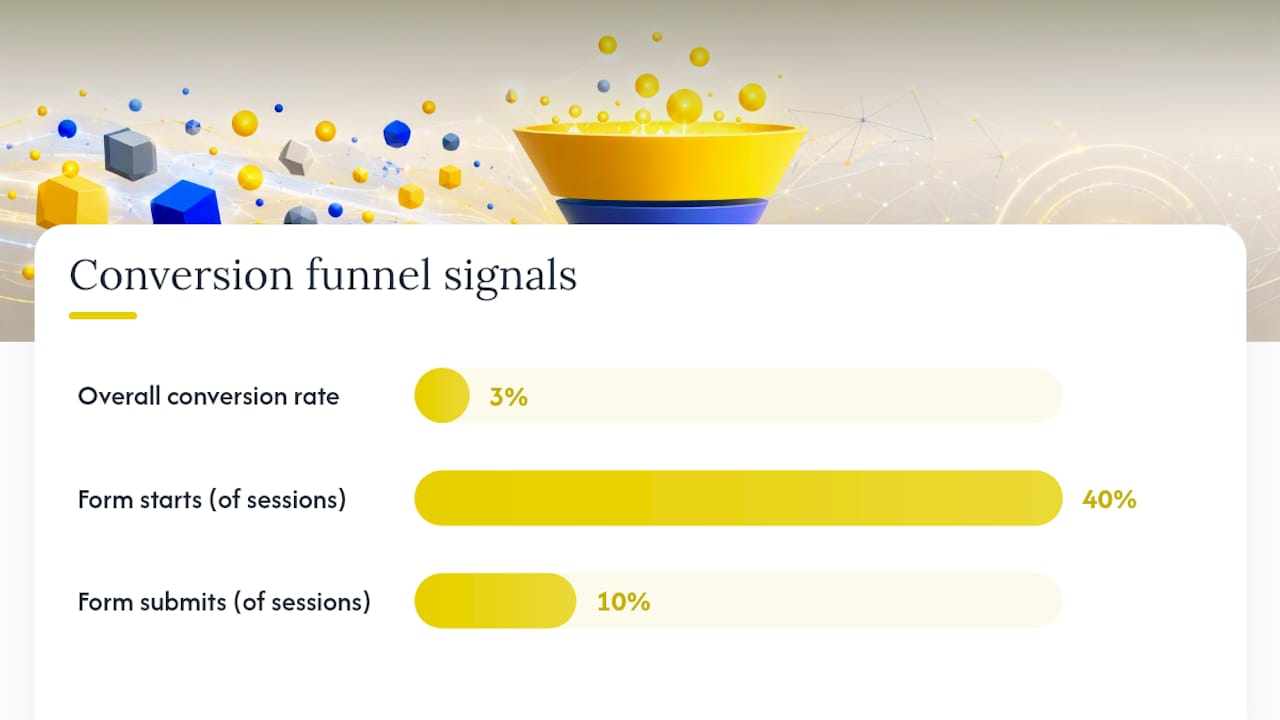
Pro Tip: Track form starts separately from form submits. If 40% of visitors start your form but only 10% finish it, you don’t have a traffic problem. You have a form-length problem.
Engagement metrics round out the picture:
- Bounce rate and exit rate show whether people leave immediately or wander before giving up.
- Average engagement time tells you if visitors are actually reading or just parking on the tab.
- Scroll depth reveals whether your CTA below the fold is even getting seen.
- Sessions by source ties every number back to the channel that sent the traffic, which matters because a Google Ads visitor and an organic visitor rarely convert the same way.
Form abandonment deserves its own line item. Measure it as form starts minus completed submits, divided by form starts. High abandonment usually traces to one of three culprits: too many fields, unclear error messages, or a mobile layout that makes typing painful.
Page speed isn’t a technical afterthought bolted onto marketing metrics. It’s a conversion multiplier. A slow-loading hero image or a render-blocking script can quietly erase gains from a better headline or a sharper offer, because half your visitors never wait around to see either one.
How Do You Set Up Tracking in GA4, Google Ads, and HubSpot?
Setup determines whether the numbers above are even trustworthy. Here’s the sequence that works across the three platforms most marketers rely on.
- Open the GA4 Landing page report. Navigate to Reports > Engagement > Landing page. Add secondary dimensions, specifically “Session source / medium” and “Landing page + query string.” This second dimension matters more than people realize: without it, GA4 collapses every UTM variant of the same URL into one row, which buries which specific campaign or ad actually drove the traffic.
- Mark form submits as a conversion event. In GA4’s Admin panel, create or mark an event (like
form_submit) as a key event so it shows up in conversion reporting instead of getting lost as generic engagement. - Open the Google Ads Landing pages report. Under Campaigns, go to Landing pages. This report exposes mobile-friendly click rate and valid AMP click rate, letting you test mobile-friendliness and AMP validity directly instead of guessing from a general speed score.
- View expanded landing pages in Google Ads if you’re running dynamic URLs or multiple destination variants under one campaign, so you’re comparing the actual pages people landed on rather than one aggregated average.
- In HubSpot, go to Content > Landing Pages, then click the Analyze tab. HubSpot surfaces default reports including a landing page summary, page-view-to-submission rate, and CTA views versus clicks, and you can save custom reports and filters once you find a view worth revisiting weekly.
- Build your event tracking checklist: form submit events, CTA click events,
scroll_depthevents at 25/50/75/100%, and page load timing. Miss any one of these and you’re flying partially blind on the next optimization round.
One more setup detail that trips up more teams than it should: consent management. If your cookie consent banner blocks analytics tags until a visitor clicks “accept,” you’re losing data on every visitor who bounces before deciding. First-party tracking setups (server-side tagging, first-party cookies scoped to your domain) preserve more continuity than third-party scripts that browsers increasingly restrict by default.
Pro Tip: Set up your GA4 secondary dimensions and your HubSpot saved report in the same sitting. Doing them separately, weeks apart, is how teams end up with two tools telling two different stories about the same page.
Why Do Landing Page Reports Give Conflicting Numbers?
The most common source of confusion isn’t bad data. It’s scope. GA4’s Landing page report is session-scoped, meaning it counts a landing page once per session, not once per user. A visitor who lands on your page Monday, leaves, and converts through a retargeting ad Thursday shows up as two separate sessions, and the credit for that conversion often gets misattributed to whichever channel sent the second visit.
This is why pairing the Landing page report with the Traffic acquisition report, using the “Landing page + query string” dimension on both, matters more than most setup guides admit. Skip that pairing and you’ll routinely credit a branded search click for a conversion that a paid social ad actually earned three days earlier.
Segmentation is where the real diagnosis happens. Break your data down by:
- Device (mobile vs. desktop conversion rates often differ by a wide margin)
- New vs. returning visitors
- Source/medium
- Landing page variant, if you’re running A/B tests
- Ad creative, when traffic comes from paid social or display
Watch for one specific red flag: a page showing unusually high conversion rate paired with unusually low engagement time. That combination sometimes signals genuine interest from a well-qualified audience, but it can also signal bot traffic or a broken conversion event firing multiple times per session. Cross-check the raw session count before you celebrate a spike.
Heatmaps and session recordings earn their place once the quantitative data raises a question the numbers alone can’t answer. If your form abandonment rate jumped 15 points after a redesign, a heatmap will usually show you exactly which field people stall on, something no dashboard number can tell you by itself.
What Should You Fix First After You Start Tracking?
Once the data is flowing, prioritize by impact times ease, not by whatever’s easiest to talk about in a meeting. Speed and mobile fixes tend to deliver the fastest, broadest lift because they affect every visitor regardless of channel or message.
- Fix load speed and mobile rendering first. Compress hero images, defer non-critical JavaScript, and reduce main-thread work. If you’re running paid traffic to AMP pages, validate them against the AMP Project’s markup standards before you scale spend into them.
- Close the traffic-message gap. If your ad promises “free shipping” and the landing page headline doesn’t mention it anywhere above the fold, you’re paying for clicks that bounce on principle.
- Simplify the form. Cut fields down to what you genuinely need at this stage of the funnel. Every additional field is a small tax on your conversion rate.
- Clarify the CTA. Test copy, color contrast, and placement. “Get Started” and “See Pricing” often perform differently enough to matter, and you won’t know which wins without testing.
- Add social proof and reduce choices. A page offering three competing CTAs usually converts worse than one with a single, obvious next step.
Pro Tip: Don’t call an A/B test before you have enough traffic to reach statistical significance. A test that “wins” after 40 conversions per variant is often just noise, and rolling out a change based on noise is how good pages get worse.
Test headline, CTA copy and placement, hero image, and form length in that rough order of expected impact. A structured creative testing framework keeps these tests from turning into an unmanaged pile of half-finished experiments. And always keep a rollback plan ready. If a “winning” variant underperforms once it’s live for the full audience, you want to revert in minutes, not days.
Why Unified Monitoring Changes How Fast You Can Diagnose Problems
Cross-channel funnel leaks rarely show up in a single report. A page might convert fine on organic traffic and fail on paid social, and you won’t catch that pattern jumping between four disconnected dashboards. A single view across Meta, TikTok, Google, and your own site events shortens the gap between noticing a problem and knowing exactly which channel or creative caused it.
This is the specific gap Gleanit is built to close. The platform runs automated monitoring of ads and customer journeys across Meta, TikTok, and Google, flagging where a funnel leaks and ranking fixes by expected return rather than leaving you to guess which one to tackle first.
For agencies juggling multiple client accounts, that matters twice as much:
- One connected view replaces the tab-switching between ad platforms, GA4, and a CRM.
- Prioritized recommendations mean less time spent debating what to fix first in a client meeting.
- Regular feature updates and AI-assisted reporting reduce the manual work of building performance summaries.
None of that replaces the fundamentals covered above. It just removes the friction between spotting a problem and acting on it.
The Real Lesson in All This Tracking Advice
Most landing page advice treats tracking and optimizing as two separate phases: measure first, then act. That’s backward for most teams. The moment you can see conversion rate and micro-conversions side by side, you already know enough to run your first fix. Waiting for a “complete” dataset before touching anything just burns traffic you’re paying for.
The conventional wisdom oversells A/B testing as the starting move. It isn’t. Testing headline copy on a page that takes six seconds to load is optimizing the wrong variable. Speed and mobile rendering fix themselves once, permanently, and lift every future test’s baseline. Save split testing for the second pass, after the technical floor is solid.
The bigger blind spot is attribution. Marketers obsess over conversion rate while ignoring that GA4’s session-scoped reporting can quietly hand credit to the wrong channel. If your dashboards disagree with each other, that’s usually the actual bug, not a data quality issue you can wave away. Fix the pairing between your acquisition and landing-page reports before you trust any number enough to act on it.
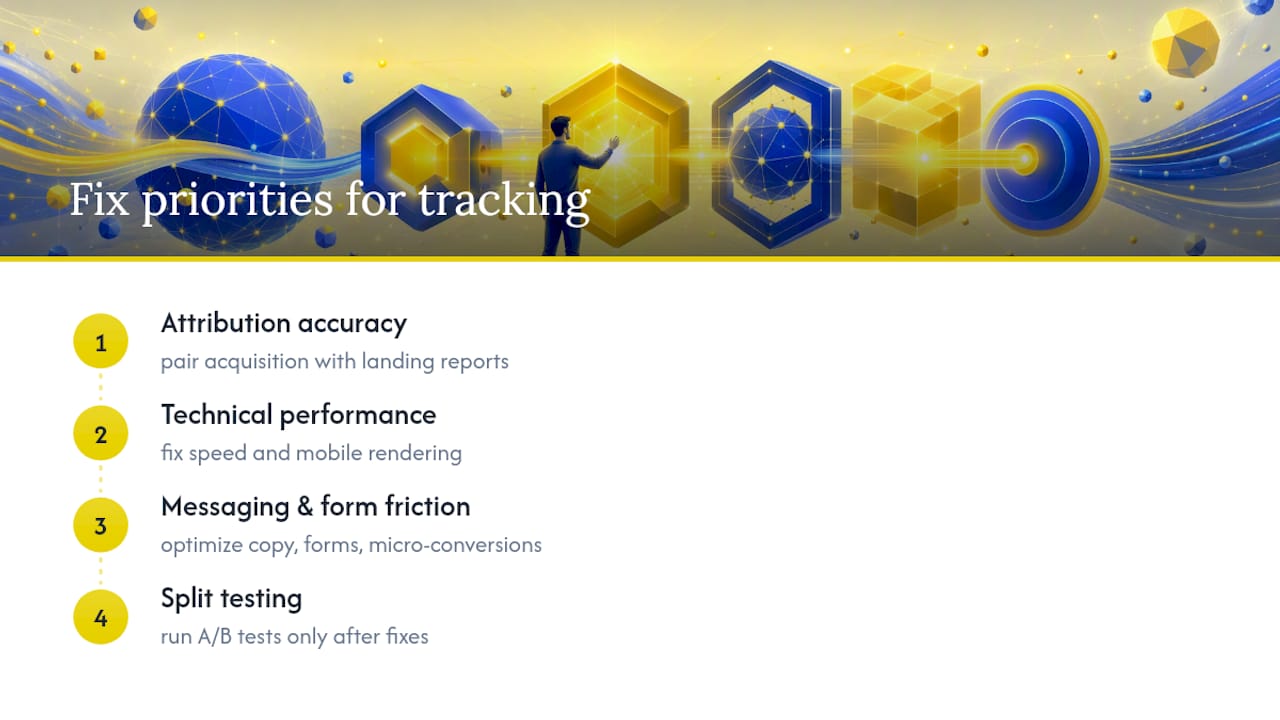
Prioritize in this order: fix attribution accuracy first, technical performance second, messaging and form friction third, split testing last.
— Ovannes
See What Gleanit Catches in Your First Week
Gleanit gives you one workspace where paid ad performance, landing page behavior, and funnel gaps sit next to each other instead of scattered across four logins. Instead of manually cross-referencing Google Ads, GA4, and HubSpot every Monday, you get automated monitoring that flags the leak and ranks the fix by expected impact.
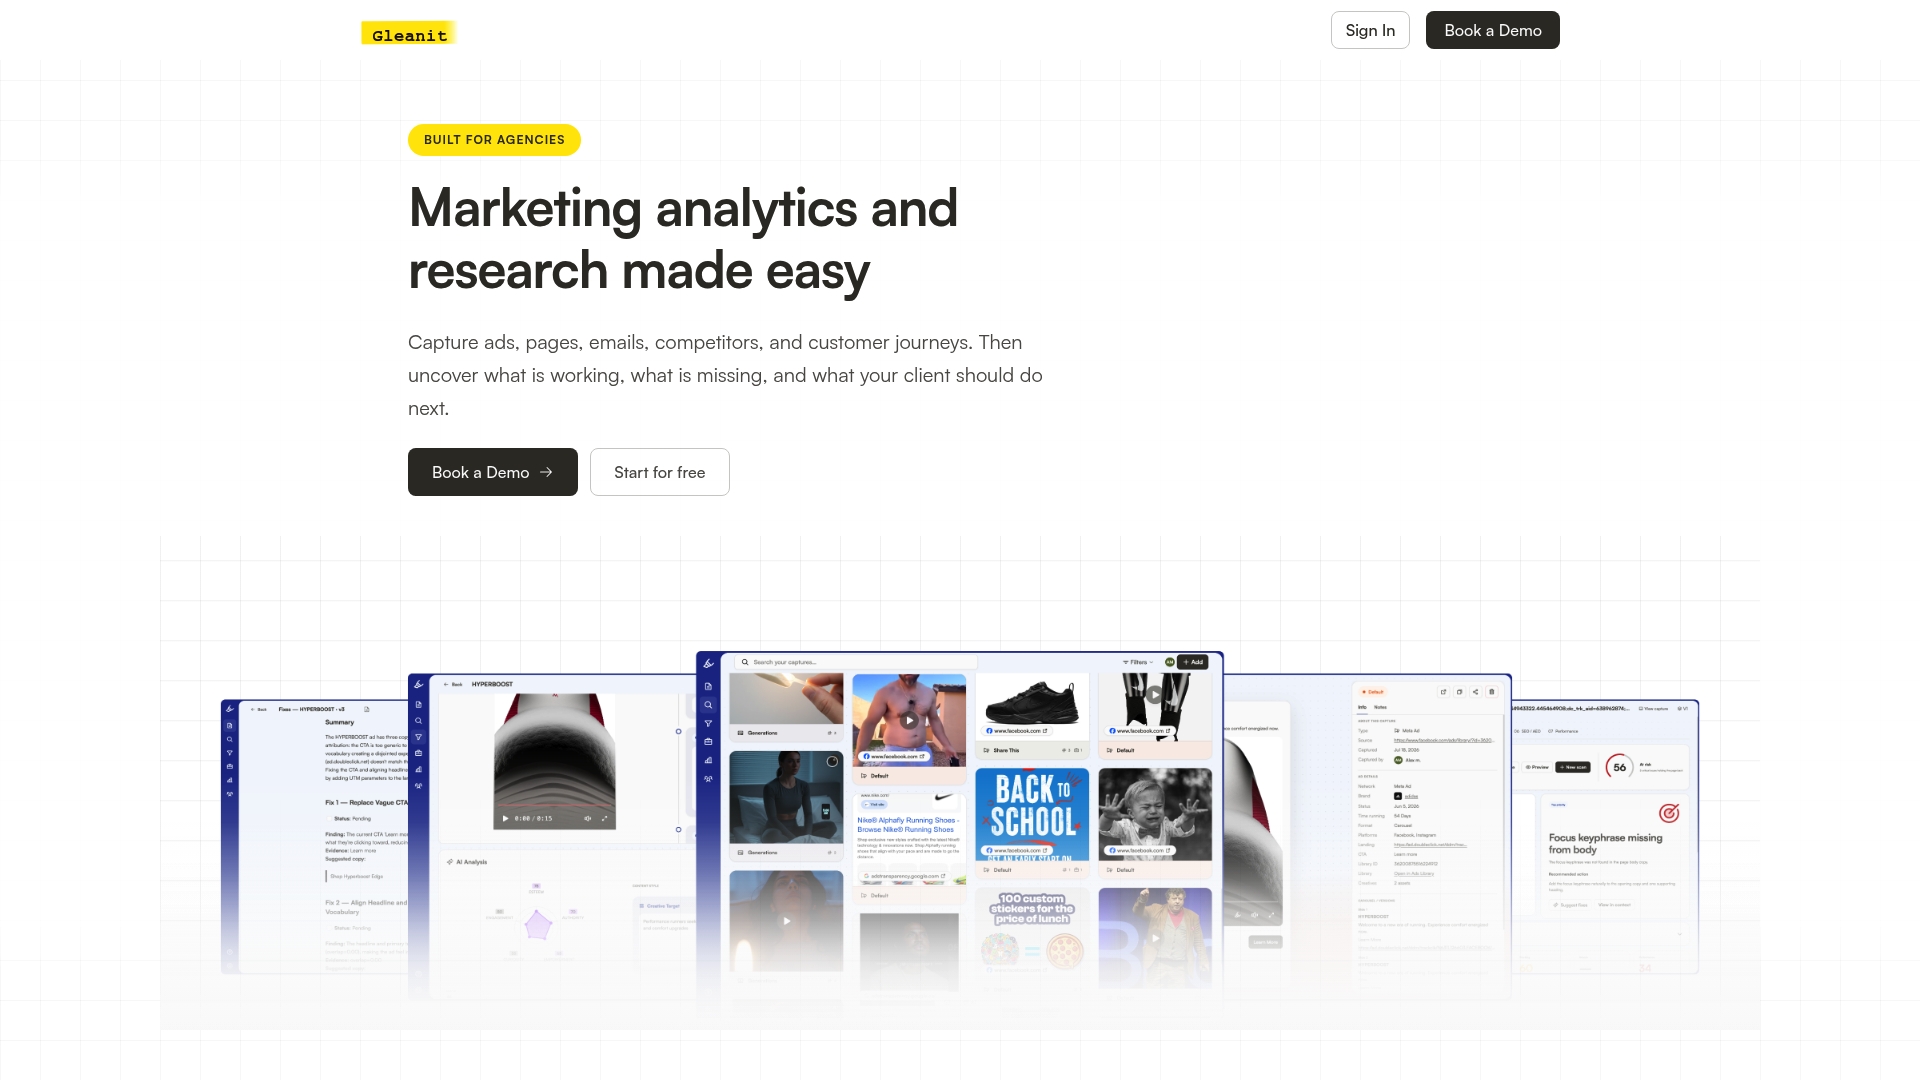
During a free trial, setup is quick and involves connecting your ad accounts. From there, you’ll see live alerts the moment a funnel step underperforms, plus a sample AI-generated report showing exactly what a client-ready summary looks like without the manual build time. If you’re also running paid campaigns that feed these landing pages, pairing Gleanit with a Google Ads monitoring checklist closes the loop between ad spend and page performance. For teams layering AI into their reporting workflow more broadly, AI-assisted marketing tools can speed up the surrounding content work too.
Start a free trial with Gleanit and see your first automated funnel report before your next client call.
Sources
FAQ
How Do You Track Website Performance Overall?
Combine a traffic and engagement tool like GA4 with a speed diagnostic and your ad platform’s own reporting. Together they show acquisition, on-page behavior, and technical performance in one connected picture.
What Are the Top Three Metrics to Monitor on a Landing Page?
Conversion rate, traffic source, and page load speed cover the acquisition, behavior, and technical dimensions of performance. Micro-conversions like CTA clicks and form starts are close behind, since they give you signal before full conversion data accumulates.
What Is a Good Conversion Rate for a Landing Page?
It varies widely by industry and offer, but top-performing pages can reach double-digit conversion rates while typical pages land well below that. Compare your page against its own historical baseline and your specific vertical rather than a single universal number.
How Do You Optimize a Landing Page After Tracking It?
Fix load speed and mobile rendering first, since those affect every visitor regardless of channel. Then close any gap between ad messaging and page headline, simplify the form, and run A/B tests on CTA copy and hero imagery once the technical basics are solid.
Can a Tool Like Gleanit Replace GA4 or Google Ads Reporting?
No. Gleanit works alongside platform-native reports, pulling ad and customer journey data across Meta, TikTok, and Google into one view so you can spot cross-channel funnel gaps faster than checking each platform separately.
Recommended
- A Creative Testing Framework That Actually Scales Ad Results
- Google Ads Competitor Research: A Practical Workflow for Marketers
- Campaign Post Mortem: A Repeatable Agency Template
- Google Ads Transparency Guide for Marketers: Workflow & Tricks
Corrections: ovannes@hearye.co or our editorial policy.