
A unified marketing dashboard pulls spend, conversions, and revenue from every ad platform, CRM, and analytics tool into one connected view, with a single attribution model applied consistently across channels. For agencies, the right move is a purpose-built, agency-ready platform, not a stitched-together spreadsheet, because manual reconciliation is where reporting accuracy and client trust quietly fall apart.
- Prioritize exception management over dashboard aesthetics.
- Normalize metrics before you visualize anything.
- Pick a single attribution model and stop debating it channel by channel.
Pro Tip: Before you build a single chart, agree with your team on one definition of “conversion” and one attribution window. Everything downstream depends on that decision.
Key Takeaways
A unified marketing dashboard works because it replaces platform-by-platform guessing with one attribution model, one dataset, and ranked recommendations your team can act on immediately.
| Point | Details |
|---|---|
| Define before you visualize | Agree on one attribution model and one conversion definition before building any chart. |
| Prioritize exception management | Anomaly alerts ranked by estimated impact matter more than a polished chart layout. |
| Expect variable timelines | Setup ranges from plug-and-play in minutes to multi-week builds for custom attribution and warehousing. |
| Pilot before you scale | Test reconciliation accuracy against real CRM revenue with one client before rolling out agency-wide. |
| Gleanit fits the agency checklist | Gleanit automates cross-platform monitoring and ranks fixes by ROI, with a free trial to pilot against your own CRM data. |
Table of Contents
- What Is a Unified Marketing Dashboard, and Why Does It Matter?
- What Core Features Should a Marketing Dashboard Include?
- Which KPIs and Widgets Belong on a Marketing Dashboard?
- How Long Does It Take to Implement a Unified Dashboard?
- How Do You Choose the Right Marketing Dashboard Platform?
- What Do Real Implementations Teach About Anomaly Management?
- How Gleanit Brings Every Channel Into One View
- Frequently Asked Questions
- Sources
What Is a Unified Marketing Dashboard, and Why Does It Matter?
A unified marketing dashboard combines one dataset, one attribution model, and one connected revenue source, replacing the patchwork of platform-native reports most agencies still rely on. The alternative, pulling Meta Ads Manager numbers here and Google Ads numbers there, then reconciling them by hand in a spreadsheet, produces a different “truth” depending on which tab you’re looking at.
Here’s the shift: instead of three team members arguing over whose spend number is right, everyone looks at one verified figure for spend, revenue, CAC, and ROAS. That single number becomes the basis for the client call.
The payoff shows up fast:
- Faster decisions, because nobody waits on a manual export to answer “is this campaign working?”
- Fewer reconciliation hours spent matching CSV exports across platforms.
- Clearer client reporting, since the numbers in the deck match the numbers in the live dashboard.
- Finance and marketing looking at the same revenue figures, which ends a surprising amount of internal friction.
Good platforms also support role-based views, so an executive sees a high-level summary, a channel manager sees campaign-level detail, and finance sees revenue reconciliation, all pulled from the same underlying data.
What Core Features Should a Marketing Dashboard Include?
Not every tool that calls itself a marketing dashboard belongs in an agency’s stack. A marketing dashboard that just aggregates metrics into charts is a reporting tool. A genuinely unified one does more structural work underneath the visuals.
Connector coverage and authentication. You need real connectors, not just export scripts, across Meta, TikTok, Google Ads, LinkedIn, web analytics, CRMs, e-commerce platforms, email tools, and offline revenue sources like a CRM’s closed-won pipeline. Some platforms take an API-first approach: Unified Advertising API normalizes campaigns, ads, reports, and creatives across multiple ad providers through a single schema and one authentication flow, which cuts down the per-platform maintenance work your team would otherwise own.
Data cleaning and normalization. Raw exports rarely agree on currency formatting, timezone handling, or even what counts as a “click.” A dashboard worth using harmonizes schema differences and enforces canonical metric definitions before anything hits a chart.
Attribution and reconciliation. One attribution engine, applied the same way everywhere, with the ability to compare first-touch, last-touch, linear, and time-decay models side by side. Without this, two team members can pull the same date range and get different ROAS numbers.
Visualization and templates. Overview dashboards, channel comparisons, funnel views, and export formats clients can actually open without a login.
Monitoring and exception management. Anomaly detection that flags a stalled campaign or a spend spike before your client notices, paired with prioritized recommendations, not just a red dot.
Security and governance. Role-based access, data lineage tracking, and clear encryption and permission controls matter more as you add client workspaces with different access levels.
Platform limits are worth checking before you commit. Some dashboard tools cap widget counts and connected boards by plan tier, which becomes a real constraint once you’re running dashboards for a dozen clients.
Pro Tip: Ask any vendor how they handle deleted or delayed conversions. A dashboard that doesn’t reconcile late-arriving data will quietly overstate performance in real time, then correct itself days later, confusing everyone who saw the earlier number.
Which KPIs and Widgets Belong on a Marketing Dashboard?
The right KPI set depends on what question you’re answering, overview health versus channel-level diagnosis.
Overview-level metrics: spend, revenue, CAC, ROAS, and pipeline velocity.
Channel-level metrics: impressions, clicks, CTR, CPC, conversions, conversion rate, and LTV by channel.
Five templates cover most agency use cases:
- Executive summary — single-number KPIs with trend context, built for a five-minute skim.
- Channel comparison — spend and ROAS side by side across every active platform.
- Full-funnel diagnosis — impressions through closed revenue, useful for spotting where prospects drop off.
- Creative performance — which ad variants are actually driving conversions, not just clicks.
- Client weekly snapshot — a condensed, export-ready view for recurring status updates.
Widget types matter as much as templates. A single-number KPI widget answers “what’s the number right now.” A trend sparkline shows direction without cluttering the view. A channel breakdown widget ranks performance by platform. A cohort funnel widget tracks how a group of users moves through stages over time. An anomaly flag widget surfaces the one metric that moved unexpectedly, so nobody has to eyeball twelve charts to find it.
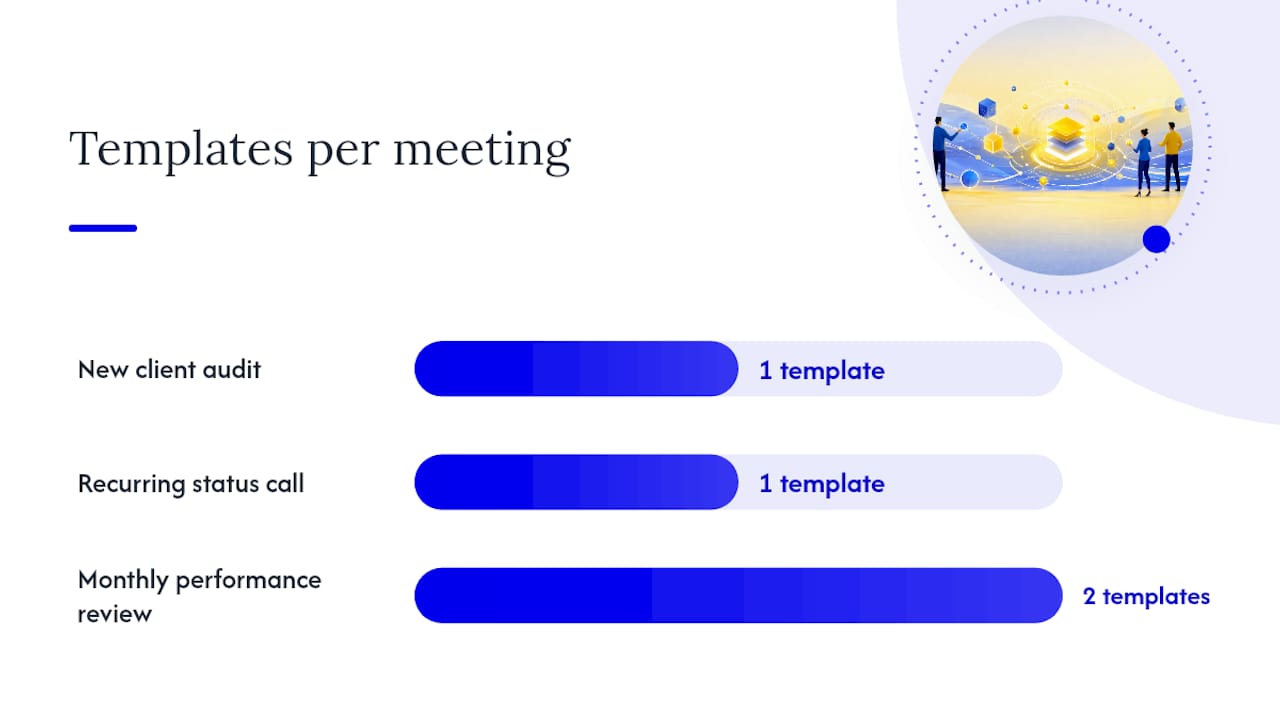
A new client audit calls for the full-funnel diagnosis template. A recurring status call calls for the client weekly snapshot. A monthly performance review usually needs the channel comparison paired with creative performance.
How Long Does It Take to Implement a Unified Dashboard?
Implementation timelines vary more by data complexity than by platform choice.
- Quick-start phase — connect ad platforms and analytics, apply prebuilt templates. This can run from a plug-and-play setup measured in minutes to a few days for basic configuration.
- Mid-tier phase — reconcile CRM revenue data, apply a chosen attribution model, and validate against known numbers. Expect one to three weeks depending on CRM complexity.
- Enterprise phase — build data warehousing, custom attribution logic, and real-time refresh rules. This can stretch into a multi-week project.
That range, from near-instant setup to multi-week builds, depends mostly on data quality, how tangled your CRM fields are, whether you need custom attribution, and how real-time your refresh cadence needs to be.
A practical phase checklist looks like this:
- Connect every data source and confirm authentication holds.
- Normalize currency, timezone, and metric definitions.
- Attribute revenue using one agreed-upon model.
- Visualize with role-based dashboard views.
- QA against known CRM revenue figures.
- Sign off with the client or internal stakeholder before scaling.
Cost drivers track closely with complexity: the number of connectors you need, whether data warehousing is required, refresh-cadence SLAs, custom attribution logic, and how many user seats or client workspaces you’re provisioning.
How Do You Choose the Right Marketing Dashboard Platform?
Run the evaluation like a real pilot, not a sales call. Build a checklist before you take a single demo:
- Connector coverage across every platform you actually use.
- Data normalization for currency, timezone, and metric definitions.
- Multiple attribution models, not just one locked-in default.
- Anomaly detection with ranked, actionable alerts.
- Client-ready reporting templates and export formats.
- API access and data portability, so you’re never locked in.
- Clear SLAs on data refresh cadence.
During any demo, ask these questions directly:
- What’s the data latency between a platform event and it showing up on the dashboard?
- How do you handle deleted or delayed conversions?
- How is currency and timezone normalization handled across regions?
- What export formats are available for client-facing reports?
- Can reports be white-labeled for client delivery?
Watch for red flags. A platform that only surfaces platform-native metrics without CRM reconciliation is a glorified export tool. No anomaly detection or alerting means you’re back to manually scanning charts every morning. Opaque attribution, where you can’t see or adjust the model, is a trust problem waiting to surface in a client meeting.
The smartest procurement move is a 30 to 60 day pilot with one real client, measuring reconciliation accuracy against actual CRM revenue and requiring data portability so you’re never stuck if the platform doesn’t hold up.
What Do Real Implementations Teach About Anomaly Management?
Most agencies overestimate how hard data access is and underestimate how hard decision-making is. The data usually exists. What’s missing is a system that tells you which anomaly matters and what to do about it.
Effective setups automate exception alerts, rank them by estimated business impact, and attach a recommended fix rather than a bare notification.
The real-time versus warehouse decision comes down to tradeoffs. A real-time API approach pulls fresh data on every request with no caching, ideal for live monitoring, but it leans on the source platform’s rate limits. A warehouse-first approach handles heavier historical reporting well but adds maintenance overhead and lag.
The most reliable setups blend the two: refresh high-priority metrics multiple times an hour, and batch heavier historical aggregations to avoid hitting rate limits.
Pro Tip: If your team keeps discovering anomalies a day late, the problem usually isn’t your dashboard, it’s that nobody owns the alert. Assign a person to act on flagged anomalies within a set window, or the best detection system in the world just becomes noise.
- Ask whether alerts include an estimated dollar impact.
- Confirm whether the platform recommends an action or just reports a change.
- Check refresh frequency for the metrics you check most often.
Why should agencies standardize on one platform instead of stitching tools together?
Ad-hoc dashboards built from five different exports create five different sources of disagreement, and disagreement is what erodes client trust fastest. Standardizing measurement and attribution on one platform cuts down disputes and shortens the time between “something changed” and “here’s what we’re doing about it.” The platforms worth paying for surface why a number moved and what to fix next, not just a chart of what happened. Start small: pilot with one client or one campaign before rolling it out across the agency.
How Gleanit Brings Every Channel Into One View
Gleanit was built around the exact problem this article walks through: agencies spending hours reconciling Meta, TikTok, Google, and LinkedIn data instead of acting on it. Gleanit automates ad monitoring and customer journey tracking across platforms, flags funnel gaps automatically, and ranks fixes by estimated ROI, so your team opens a report that already tells you what to do next.
That matches the checklist point by point: broad connector coverage across major ad platforms, normalized metrics so numbers mean the same thing everywhere, anomaly detection with prioritized recommendations instead of raw alerts, role-based agency workspaces for client separation, and export-ready reports built for client delivery. New features ship weekly, so the connector and AI capabilities keep pace with how fast the ad platforms themselves change.
The best way to evaluate it is the same way this article recommends evaluating any platform: run a pilot. Start a free trial at Gleanit with a single client or campaign, and measure two things directly, how closely the dashboard’s numbers reconcile against your CRM revenue, and how much reporting time your team gets back in the first month.
Frequently Asked Questions
What’s the difference between a marketing dashboard and a unified marketing dashboard? A standard marketing dashboard often visualizes data from a single platform or a loose collection of exports. A unified marketing dashboard applies one attribution model and one normalized dataset across every channel, so the numbers agree with each other by design.
How long does it take to build a unified marketing dashboard? It ranges from a plug-and-play setup measured in minutes for basic connector and template use, to several weeks for enterprise builds involving CRM reconciliation, data warehousing, and custom attribution logic.
Do unified dashboards work for small agencies, or only large ones? Purpose-built platforms scale down as easily as they scale up. A small agency can pilot with one client’s data before deciding whether to roll the platform out across its full client roster.
What’s the biggest mistake agencies make when unifying marketing data? Skipping the normalization step. Connecting every platform without agreeing on currency handling, timezone settings, and a single attribution model just moves the reconciliation problem into the dashboard instead of solving it.
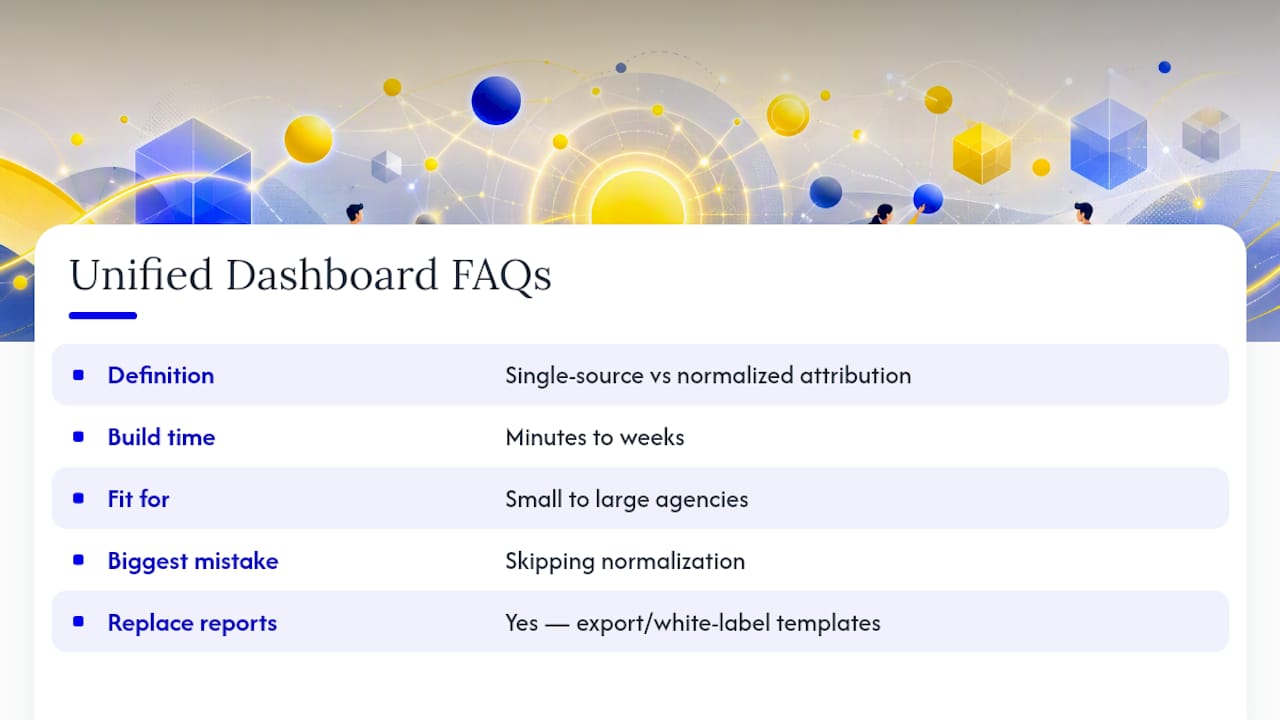
Can a unified dashboard replace client-facing reports? Yes, when it includes export-ready or white-labeled templates. Many agencies use the same underlying dashboard for internal monitoring and client delivery, cutting duplicate reporting work entirely.
Sources
Recommended
Corrections: ovannes@hearye.co or our editorial policy.