
Prioritize marketing experiments by scoring each idea against your business objectives and its expected impact, using a method like RICE or expected value, then sequence the winners by risk and traffic needs. This article walks through a ready-to-run 60 to 90 minute workshop, a readiness checklist to gate weak tests, and scoring templates your team can use inside two weeks.
TL;DR:
- Use RICE for a dozen or more comparable ideas, ICE for fast weekly ranking, and expected value for a few high stakes, uncertain bets.
- A 60 to 90 minute workshop can rank ideas, sequence finalists by traffic needs and risk, and assign owners and target dates.
- Before launch, confirm traffic can detect the minimum effect, validate event tracking, avoid overlapping tests on the same audience, and document metrics and rollout rules.
- Google Ads guidance allows 7 to 14 days for learning and recommends 4 to 6 weeks for many ad tests to detect meaningful effects.
- Log wins, losses, and inconclusive results in a shared library, then update confidence estimates after each test to prevent stale rankings and repeated hypotheses.
Table of Contents
- Why prioritize by business objective and expected impact
- Prioritization frameworks you can use today
- A 60 to 90 minute prioritization workshop to rank your backlog
- Experiment readiness checklist: what to check before you launch
- Interpreting results and guarding against validity threats
- How agencies operationalize prioritization
- Integrating customer journey insights into experiment prioritization
- Common mistakes and the one thing leaders should fix first
- How Gleanit helps teams prioritize and run experiments
- FAQ
- Sources
Why prioritize by business objective and expected impact
Most backlogs fill up with ideas that sound clever in a meeting but never connect to a number the business cares about. An outcome-first approach starts from the opposite direction: mission, then objective, then the KPI that proves it, then the experiments that could move that KPI. When every idea has to justify itself against a stated objective before it earns a slot, the backlog stops being a popularity contest.
Idea-first selection has a predictable failure pattern. Someone pitches a test because a competitor tried it, or because a stakeholder liked a tactic from a conference talk. The team runs it, the result is flat or marginal, and six months later a slightly different version of the same idea resurfaces because nobody logged why it failed the first time. Without an objective filter, teams end up re-testing variations of the same low-value hypothesis instead of moving toward higher-leverage work.
The AMA Marketing Experiment Planning Workbook addresses this directly with a prioritization matrix, an experiment brief template, and a test readiness check built to compare ideas by expected impact, confidence, and effort before anyone commits resources. Google’s guidance on incrementality testing reinforces the same principle from the measurement side: planned, measurable experiments produce decisions you can act on, while ad-hoc tests tend to produce numbers nobody fully trusts.
A workable objective-first filter looks like this before any scoring begins:
- State the single business objective the quarter is built around, such as lowering cost per acquisition or lifting trial-to-paid conversion.
- Require every candidate idea to name the KPI it would move and roughly how much.
- Reject or shelve ideas that cannot name a KPI connection, even if they sound promising.
- Group surviving ideas by funnel stage so you can see where effort is concentrated.
This filter does not replace scoring, it just keeps scoring sessions from wasting time on ideas that were never going to matter. Teams that skip this step often discover halfway through a workshop that half the backlog has nothing to do with the quarter’s actual goal.
Prioritization frameworks you can use today
Once a backlog has cleared the objective filter, you need a scoring method that turns opinions into comparable numbers. Three frameworks cover almost every situation a marketing or growth team faces: RICE, ICE, and expected value.
RICE scores each idea on Reach, Impact, Confidence, and Effort, then combines them into a single score, typically Reach multiplied by Impact multiplied by Confidence, divided by Effort. Reach is the number of people or sessions the test could touch in a given period. Impact is usually a simple scale, such as 0.25 for minimal, 1 for moderate, 3 for massive. Confidence is a percentage reflecting how sure you are about your Reach and Impact estimates, based on data quality or past results. Effort is measured in person-weeks or person-days. RICE works well when you have a dozen or more ideas competing for the same sprint and you need a repeatable number everyone can audit.
ICE drops Reach and scores only Impact, Confidence, and Effort, each on a simple 1 to 10 scale, then averages or multiplies them. It sacrifices precision for speed, which makes it a reasonable choice for a fast weekly grooming session where you just need a directional ranking rather than a defensible score for a leadership review.
Impact-Probability, or expected value, multiplies a forecast uplift by the probability that the test succeeds: EV = forecast uplift × probability of success. This framework fits strategic, high-uncertainty bets better than RICE does, particularly in what practitioners sometimes call wartime conditions, when a metric is declining and the team needs to weigh a few big swings rather than many small tactical tests.
Statistic callout: Research on profit-maximizing test design, published in Marketing Science, shows that smaller test sizes than traditional hypothesis testing can actually increase expected profit in noisy or small-population settings, which matters directly when you are deciding how aggressively to size an experiment during prioritization.
A quick numeric example shows how EV reorders a backlog that RICE would rank differently. RICE, which rewards confidence and reach heavily, might favor Idea A even more strongly, while a pure EV lens still ranks A ahead here, but the gap narrows once you factor in that Idea B’s upside is much larger if it works.
- Use RICE when you have many comparable, tactical ideas and need a defensible, repeatable score.
- Use ICE when speed matters more than precision, such as a weekly grooming session.
- Use expected value when you are comparing a small number of high-uncertainty, high-stakes bets.
- Revisit confidence and probability inputs after every test, since stale estimates quietly distort every future ranking.
Teams adopting RICE for the first time often benefit from a worked example and agenda, which we cover in more detail in our RICE scoring workshop guide.
A 60 to 90 minute prioritization workshop to rank your backlog
A ranked backlog does not require a multi-day offsite. A single, well-structured session can take a messy list of ideas and produce a sequenced plan with owners attached, provided the right pre-work happens first.
Pre-work (before the room fills up):
- Collect every candidate idea with an owner, a one-line hypothesis, the key metric it targets, and a rough effort estimate.
- Pre-fill as much of the scoring matrix as possible using existing data, such as traffic volumes, past test results, or funnel gap reports.
- Share the objective statement and KPI for the quarter so nobody arrives without context.
During the session:
- Facilitator opens with a 15-minute intro covering the quarter’s objective and a quick calibration exercise so everyone scores Impact and Confidence the same way.
- Run a 30-minute lightning round where each owner pitches their idea in two minutes or less, no slides.
- Spend 25 to 40 minutes scoring every idea against the matrix, resolving disagreements through short discussion rather than letting one voice dominate.
- Close with 10 to 15 minutes sequencing the top-ranked ideas by traffic needs and risk, then assign owners and target dates.
Pro Tip: Pre-fill as many Reach and Impact fields as you can before the workshop starts, since a room spending its time debating input numbers instead of discussing strategy has already lost the session.
The output of a good session is not just a ranked list. It includes ready-to-launch flags for ideas that passed the readiness check, a documented decision rule for each test, named owners, and a rough launch calendar. Without those four things, the ranking is just a spreadsheet that nobody revisits.
Follow-up matters as much as the session itself. A short weekly grooming cadence, 30 to 60 minutes, keeps the backlog current and catches ideas that have gone stale. Pair that with a results library that logs every test outcome, win, loss, or inconclusive, so the next workshop starts from actual history instead of memory. Our guide on running a 30-minute weekly grooming session covers this cadence in more detail, and our scan, score, sequence playbook walks through a tighter 90-minute version for teams prioritizing fixes rather than net-new ideas.

Experiment readiness checklist: what to check before you launch
A high-scoring idea can still fail if it launches before the team has checked whether the test can actually produce a trustworthy answer. A short gate checklist, run right before launch, catches the most common execution failures.
Traffic and sample size. Estimate the minimum detectable effect you need against your expected uplift, then estimate how long the test needs to run to reach it. A test with too little traffic will sit inconclusive for weeks, burning a slot that a better-suited idea could have used.
Instrumentation and analytics health. Confirm that events fire correctly, that your tag manager setup is current, that duplicate events are deduplicated, and that user IDs are consistent across the channels the test touches. A broken event tag can quietly invalidate weeks of data before anyone notices. Our tracker fields checklist covers the specific fields product and marketing teams tend to miss.
Isolation rules. Avoid running two experiments that touch the same audience or funnel stage at the same time, since overlapping tests confound each other’s results. For ad platforms specifically, Google Ads guidance on experiments recommends running tests sequentially where possible and respecting the platform’s learning phase.
Decision rules defined before launch. Write down the metric you will judge the test on, the minimum detectable effect, the confidence threshold you will accept, and the rollout plan if the test wins. Deciding these after seeing the data is how teams talk themselves into weak results.
- Confirm expected traffic can reach your minimum detectable effect within a reasonable window.
- Verify event tracking and user ID consistency before launch day, not after.
- Check for overlapping tests on the same audience or funnel stage.
- Write the decision rule down and share it with stakeholders before the test goes live.
Statistic callout: Google Ads experiment guidance recommends allowing for a learning phase of 7 to 14 days and running many ad experiments for at least 4 to 6 weeks to detect meaningful effects, a timeline worth building into your launch calendar before you commit a slot to a test.
Interpreting results and guarding against validity threats
Reading a result correctly matters as much as picking the right idea in the first place. Lift, the raw difference between a test and control group, only equals true causal incrementality when the test was isolated, properly randomized, and free of platform-level interference. When those conditions are not met, a dedicated incrementality study or holdout design gives a cleaner read.
Several validity threats show up repeatedly in marketing experiments. Instrumentation problems, such as a tracking pixel that fires inconsistently across devices, can distort a result without anyone noticing until the numbers stop making sense. Algorithmic confounding is a more specific risk on ad platforms: AMA research found that platform delivery algorithms can skew A/B test results in ways that make the test group look artificially better or worse than it actually performed. Overlapping tests on the same audience are a third common threat, since two simultaneous experiments can interact in ways neither alone would predict.
A few quick diagnostics catch most of these before they waste a decision cycle:
- Check whether sample sizes and traffic splits matched your pre-launch plan, not just the final totals.
- Compare results across devices or segments to spot instrumentation gaps.
- Confirm no other experiment touched the same audience during the same window.
Inconclusive results are not failures, they are data. Log them in a central results library instead of letting them disappear into a slide deck nobody opens again. Google’s measurement guidance on experimentation and incrementality testing makes the same point: teams that preserve inconclusive outcomes avoid repeating the same hypothesis in a slightly different wrapper six months later.
The profit-maximizing test-size research published in Marketing Science is useful context here too: in noisy environments, a smaller, profit-aware test size can outperform a large significance-driven test, which means you do not always need to chase textbook statistical power to make a sound business decision.
How agencies operationalize prioritization
Agencies running prioritization at scale tend to settle into a predictable rhythm: a short weekly grooming session to keep the backlog current, paired with a full ranking workshop monthly or quarterly when the objective shifts or a new client comes online. The weekly session catches drift, the bigger session resets the whole backlog against the current goal.
The slowest part of any prioritization session is usually hypothesis discovery, figuring out where the funnel is actually leaking and what a competitor is doing that might be worth testing. Automated funnel-gap detection and competitor ad capture shorten that step considerably by pre-filling Reach and Impact estimates directly into the scoring matrix before the workshop starts, which is the gap we built our platform to close for agencies managing several client accounts across ad platforms at once.
A typical output set from a session like this includes:
- A ranked list of prioritized fixes tied directly to funnel gaps rather than guesses.
- Pre-filled experiment briefs with hypothesis, metric, and effort already populated.
- A test-launch checklist confirming tracking and decision rules before anyone hits publish.
Pro Tip: Feed last month’s funnel-gap report directly into this month’s grooming session, since the gaps that persist across two cycles are usually your highest-confidence Impact scores.
Integrating customer journey insights into experiment prioritization
A backlog built only from isolated channel metrics misses how a prospect actually moves through your funnel. Multi-channel analytics that track the same person from an ad click through an email open to a landing page visit reveal friction points a single-channel view cannot show, and those friction points are often where the highest-impact experiments live.
Say a journey map shows that prospects who click a Meta ad but bounce off the landing page rarely return through email remarketing. That single insight points toward two testable ideas at once: a landing page variant matched to the ad’s promise, and a faster remarketing trigger. Scoring these against a journey-informed Reach number, rather than a single-channel estimate, usually pushes them higher in a RICE or expected-value ranking than they would land using channel data alone.
Journey insights also help catch isolation risks before they happen. If two teams are independently testing changes to the same stage a prospect passes through on their way to conversion, cross-channel visibility is often the only way to see the overlap before it muddies both results.
Common mistakes and the one thing leaders should fix first
The mistake we see most often is not a bad framework, it is the absence of any framework applied consistently. Teams score ideas loosely in a meeting, the loudest voice wins, and six months later nobody remembers why a test was skipped. Governance, in the form of a pre-filled matrix and a written decision rule, takes that politics out of the room by forcing every idea through the same gate.
The second mistake is losing institutional memory. Without a results library and a short grooming cadence, teams quietly re-test the same hypothesis in a new wrapper every quarter.
If you take one action from this article, make it this: schedule your first 90-minute workshop within the next two weeks, and capture every output, scores, owners, decision rules, in one central place your whole team can see.
— Ovannes
How Gleanit helps teams prioritize and run experiments
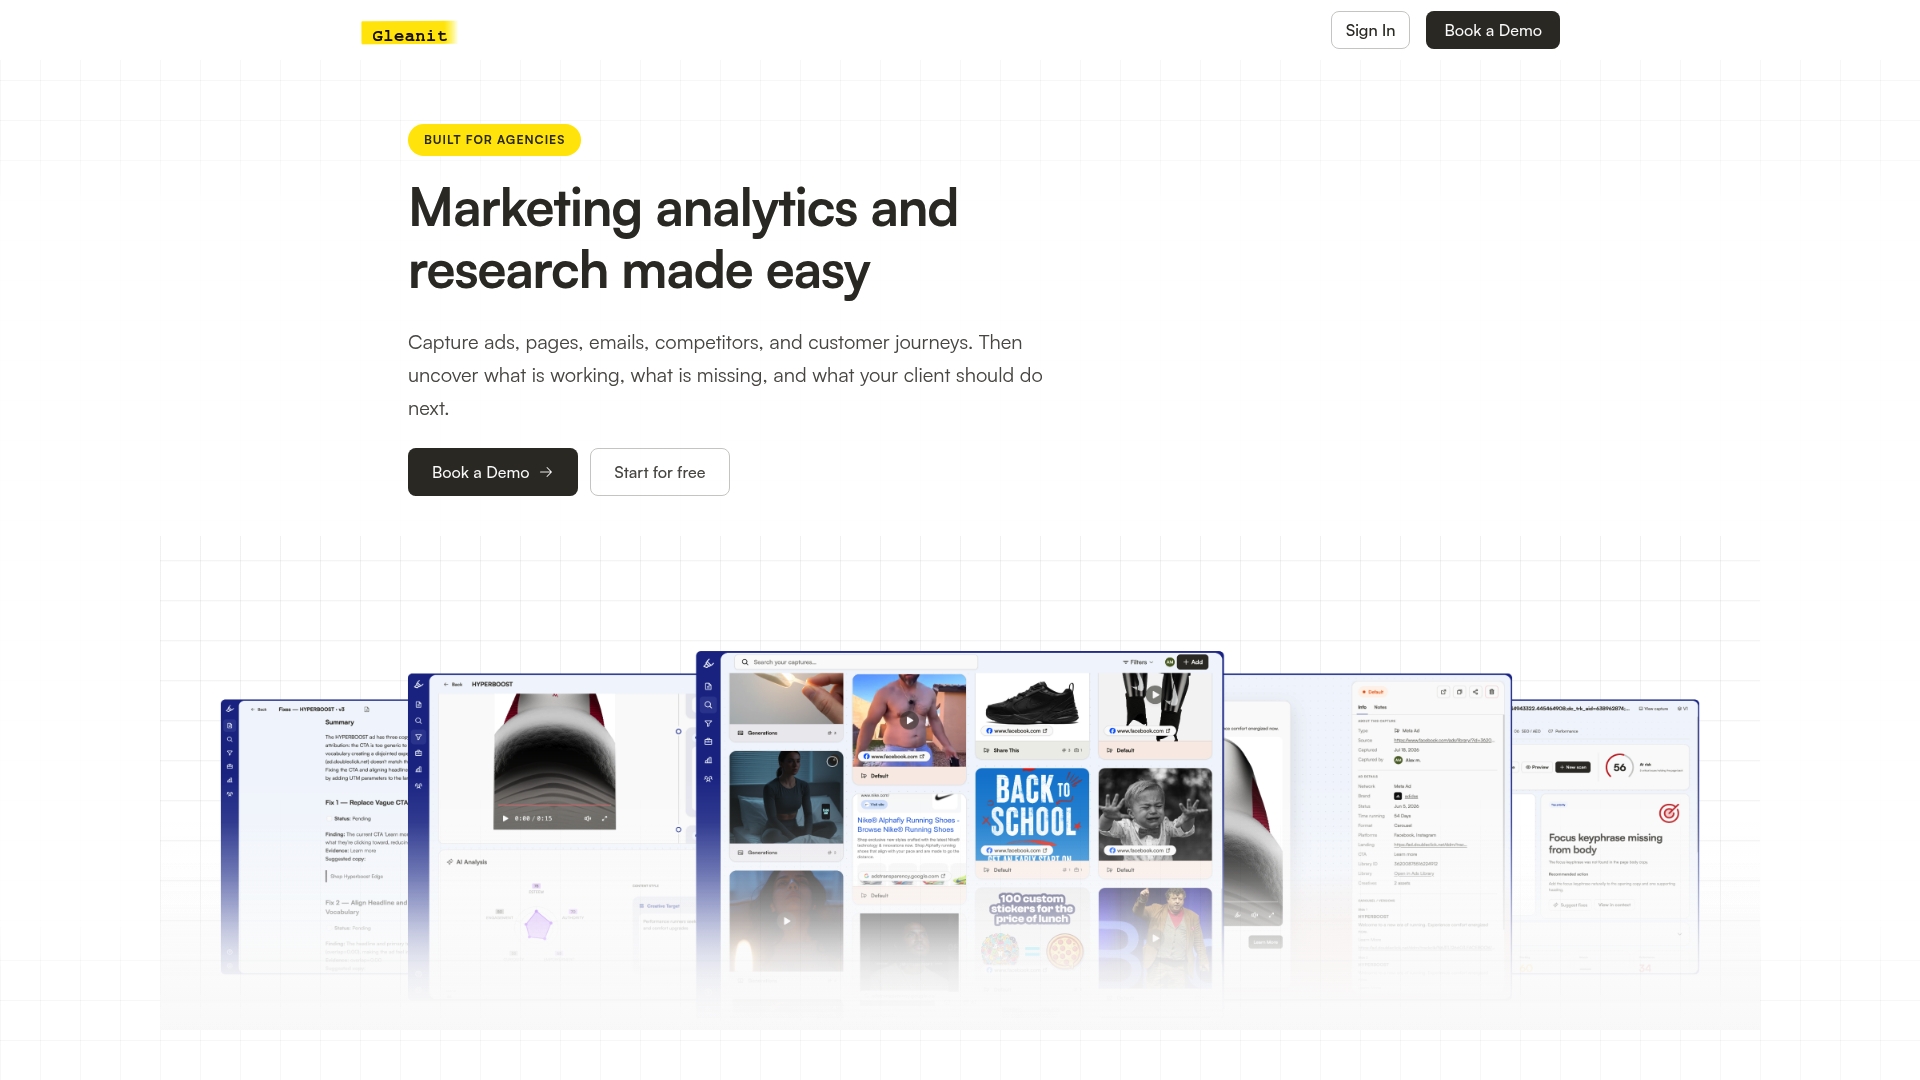
Running a prioritization workshop is far easier when the Reach and Impact fields are not blank guesses. We built our platform to monitor ads and customer journeys automatically across multiple ad platforms, surface funnel gaps, and provide prioritized, ROI-ranked fixes along with pre-filled experiment briefs, with frequent feature updates.
A low-friction way to see this in action: run a free ad audit or a free marketing audit on a current campaign.
- See competitor gaps with a free competitor analysis.
- Check landing pages and email flows with a free landing page audit or free email audit.
- Compare the Solo and Agency plans on Gleanit pricing when you are ready to run this automatically every week.
For teams that also want broader SEO and content experimentation support, conversion rate optimization tips from Baby Love Growth pair well with the frameworks above.
FAQ
What is the main goal of marketing research?
The main goal of marketing research is to reduce uncertainty before a decision gets made, whether that decision is a campaign, a product change, or a pricing move. It gives teams evidence about customer behavior and market conditions instead of relying on assumptions, which is the same reasoning that supports prioritizing experiments by objective rather than by gut feeling.
Can you give me some examples of field experiments?
Field experiments in marketing include geo-based holdout tests, where one region sees a campaign and a matched region does not, and incrementality tests on ad platforms that compare exposed versus unexposed audiences. Landing page and email A/B tests run in live traffic are also field experiments, since they measure real customer behavior rather than a simulated environment.
What should you do before starting an experiment?
Before launching, confirm the test has enough traffic to detect your expected effect, check that tracking and event instrumentation are working correctly, and make sure no other test is running on the same audience. You should also write down your decision rule, the metric, the minimum detectable effect, and the rollout plan, before you see any data.
What is the 7-11-4 rule in marketing?
The 7-11-4 rule is a popular marketing heuristic suggesting a buyer needs multiple hours of content exposure across several touchpoints in different channels before converting. Definitions and the exact numbers vary across sources, so treat it as a directional reminder to plan multi-touch, multi-channel journeys rather than a precise target to hit.
Sources
- AMA Marketing Experiment Planning Workbook
- Test & roll: profit-maximizing A/B tests | Marketing Science (INFORMS)
- Strengthen media measurement and ROI clarity with incrementality testing improvements. - Google Ads Help
Recommended
- 30 Minute Weekly Grooming: Marketing Experiment Backlog Cuts Idea Rot
- Prioritize Marketing Fixes in 90 Minutes: Scan, Score, Sequence
- Rank Marketing Campaigns with RICE: 60–90 Minute Workshop + Example
Corrections: ovannes@hearye.co or our editorial policy.